
— Most stock charts will give you subtle clues as to what traders are truly thinking. You just have to know where and what to look for —
We're big fans of trading systems, as they take the emotion-supplied pitfalls out of trading and turn it into a process; emotionally-driven decisions tend to do more harm than good. We'd never deny there's an art aspect to a technically-driven, scientific approach to finding trade setups though. And when this art drops clear clues that support your algorithm, so much the better.
We were given one of these unexpected, add-on clues on Monday, supporting a setup for a trade we made for our Earnings Extravaganza alert service. It's worth a look just because there's something to be learned from it.
But, first things first.
Our Earnings Extravaganza options trading newsletter [1] is a bit different than our other services. Rather than using specific chart-based trade triggers to find good trades, we're aiming to capitalize on sharp volatility resulting from earnings news. This requires something of a leap of faith as to which direction a stock is going to move following an earnings report. That doesn't always clearly show up on a chart. Indeed, it's rarely obvious on a chart given how unpredictable post-earnings moves have been in recent quarters.
There are subtle hints, however, that help out.
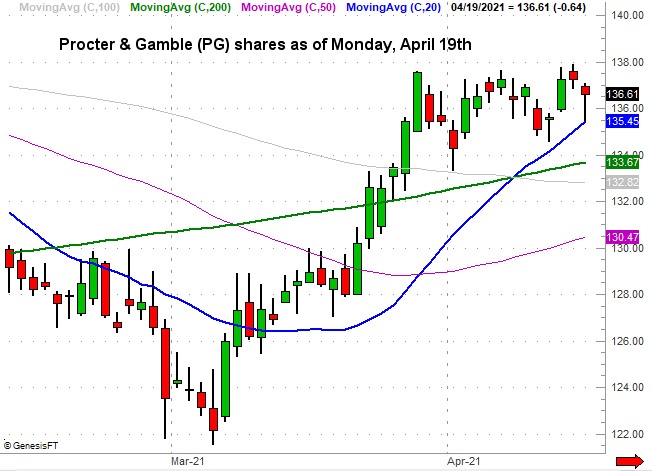
Take, for instance, the Earnings Extravaganza's purchase of Procter & Gamble (PG) call options on Monday in front of its pre-open release of last quarter's results on Tuesday. With nothing more than a passing glance we can see a broad uptrend, but by late Monday – when we bought the calls — P&G shares were actually down for the day. Take a closer look though. While down for the day, the stock was also well up from its intraday low, buoyed by a kiss of its 20-day moving average line (blue). It's a sign that when push came to shove, the bulls "wanted it" more than the bears did. It was also a sign that traders were gearing up for a bullish response, perhaps unconsciously (or even consciously) knowing the numbers would be good.
 [2]
[2]
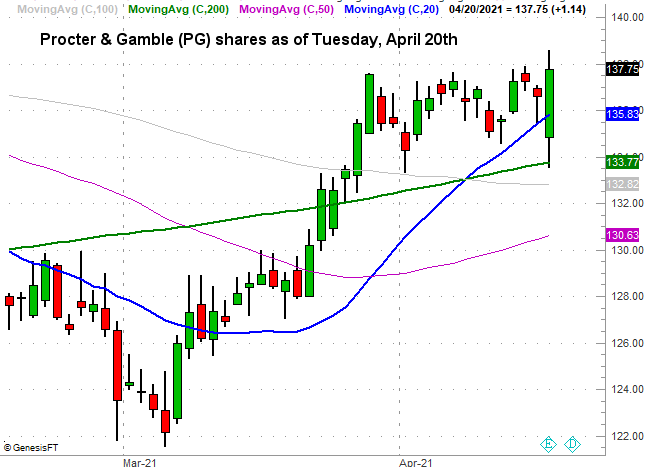
Here's what we got on Tuesday, April 21st. Though the initial response to the numbers was bearish (and got worse before they got better), after traders had some time to think about it that sparked a bullish session anyway.
 [3]
[3]
It was touch-and-go early in Tuesday's session, of course. PG stock as well as our calls creeped uncomfortably into the red for a short while. Before too terribly long though, we saw another bullish clue. That is, a kiss of the 200-day moving average line (green) prompted an intraday rebound that carried P&G stock to its highest close in months. That's right where the bulls would have been expected to make a strong stand.
There's more to this, however, than where the reversals took shape. The shape of the bars themselves are telling, from Monday as well as Tuesday.
Monday's bar – the one that brushed the 20-day moving average line – is shaped like a hammer. Or, more specifically, a mallet, where the open and close are near one another and also near the day's high, with a deep low in between them. This "long tail" indicates an intraday swing from pretty strong bearishness to a little bullishness as the closing bell approached. In fact, this sort of bar is called a "hammer [4]," although they usually take shape after a sustained selloff. Still, the underlying sentiment is the same… the bulls had a chance to throw in the towel, but ultimately chose not to.
Tuesday's bar provided a noteworthy lesson as well. This is called an engulfing pattern, and in this case, it's a bullish engulfing bar. That just means the span between Tuesday's open and close completely engulfs the previous day's low-to-high range. It also reverses the direction, meaning Monday's close was below the open by just a little, while Tuesday's close was above the open. This sweeping, engulfing action is a sign that the bulls are committed, and came roaring back even after a bearish open. This of course was something we saw a glimpse of on Monday. You'll also hear this pattern described as an outside day [5].
What's so interesting is that while our calls pulled back in price when PG shares did early Tuesday, they didn't plunge. Part of that is attributable to the sheer increase in volatility; big price swings inflate the premiums for options whether they're calls or puts.
Part of that relatively firm price, however, can also be attributed to the fact that the market was never really decidedly bearish on P&G despite Tuesday's rough start. That's why the call options never quite threatened our established stop-loss.
Trading is of course a subtle art. These hints were pretty clear, but not all of them will be. It doesn't matter, however. You still have to find and glean the clues you can. The more you do it, the easier it becomes to spot the nuances that support (or reject) the trading signals you're getting.
And, almost needless to say, Tuesday's engulfing bar has us pretty excited about our P&G calls. The next bullish hint will be the move above the recently-developed technical ceiling around $137.76 (blue, dashed).
If you'd like help tapping into the volatility created by earnings news, our Earnings Extravaganza advisory is scoring some big wins. We've only just entered this quarter's earnings season though, so there's plenty of time to bag some winners in the next few weeks. Go here to learn more [1].