In retrospect, the weakness that started to take shape a couple of weeks ago shouldn't have come as a big surprise. More important, the clues that told us at least a slight lull was in the works is still telling us the pullback has yet to run its full course. How much more downside is left ahead remains unclear. But, a little could readily turn into a lot.
That big hint comes to us courtesy of Richard Arms, via a tool called the Arms Index; you'll sometimes hear it called the Trading Index, or TRIN. In simplest terms, the Arms Index compares a ratio of a particular index's up and down volume to its advancers and decliners figures. When all is as it should be, the Arms Index or TRIN reading is right around 1.0… meaning everything is in balance. Things could be wildly bullish or painfully bearish, but as long as breadth and depth jibe with one another, that trend can last indefinitely.
It's when things get 'out of whack' where trouble begins (or ends). That is, when there's not enough bearish volume compared to decliners or too many advancers compared to bullish volume, something's getting closer to changing.
Ergo, the interpretation is, when the TRIN reading or the Arms Index pushes above 1.2 or below 0.90, there's an imbalance that's about to reverse course.
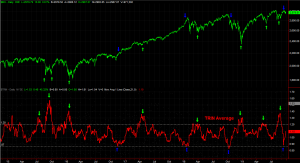
Our graphic comparing the S&P 500 to the NYSE's Arms Index below makes this point pretty plainly. When the TRIN level gets too high, a bottom is usually in the works. When it gets too low, stocks are usually about to top.
The NYSE's TRIN reading fell below 0.90 a couple of weeks ago. Like clockwork, the market tipped over.
 [1]
[1]
The marketwide selling won't be pressured to stop – by the TRIN level anyway – until the moving average of the data in question gets back above 1.2. It's en route to that level right now, although there's no assurance it will get all the way there. It could slow down before reaching that level, which leaves plenty of room for stocks to continue drifting lower.
It's not a laser-precise tool in terms of timing, but it's an incredibly helpful tool in terms of trying to figure out where key turning points might be taking shape.
There's a huge problem with the Arms Index right now, however, that has to be acknowledged so it can be properly addressed.
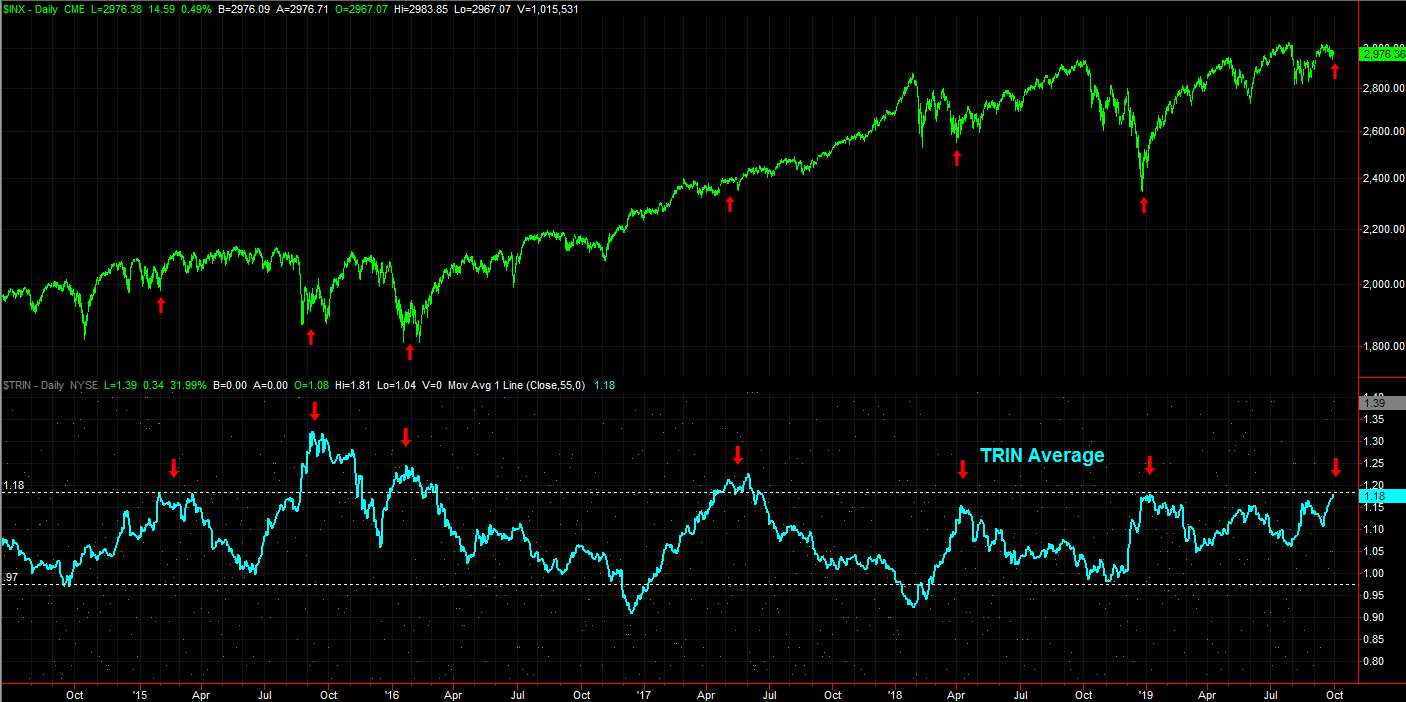
The chart of the S&P 500 and the Arms Index above is a look at the short-term TRIN trend. It says there wasn't enough bullish volume from two weeks ago to sustain the rally at the time, and sure enough, the market drifted lower. The picture can change dramatically when you stretch out the time TRIN reading's timeframe to something much longer and bigger-picture, as we have below.
Using this longer-term moving average of the daily TRIN data (as a means of identifying more significant turning points), we're near a major bottom… based on the NYSE's breadth and depth.
 [2]
[2]
It admittedly doesn't look like the market is anywhere near a huge low, like the one we say in December, or even the one we saw very early last year. But, that IS what the Arms Index long-term trend is telling is right now. Even though the short-term undertow may be technically bearish, longer-term, there's actually a lot of pent-up buying volume that's aching to be unleashed.
It's possible both charts are right, so to speak. That is, there's a little more downside to go in the short run, but that small dip would be a very good longer-term buying opportunity. Good traders (and investors) always have to be able to differentiate short-term and long-term moves.
Regardless, this is interesting to say the least.
It also doesn't align with the headlines of late, most of which have encouraged investors to be at least cautious, if not get out of stocks altogether. Most traders have acknowledged that's the message to digest here, but that hasn't really beaten down stocks. Under the surface, traders are quietly prepared to start buying en masse again, even though they've technically been buying already. They just haven't been buying in volume. There's room for traders to step in again, even at these elevated price levels.
This is why we concurrently review the short-term and long-term looks at the TRIN/Arms Index data.
It's just one piece of information among many that you should be looking at. It's also worth reminding you that the Arms Index data isn't laser precise; the long-term Arms Index data is even less precise than the short-term data is.
Nevertheless, the fact that the long-term TRIN reading is as lofty as it as at a point in time when it theoretically shouldn't be can't be ignored. It actually jibes with the prospect that the market usually rallies to end the fourth quarter, with that rally usually kicking off sometime in the middle of October.
If you'd like to learn more about TRIN, or the Arms Index, go here [3].