It's been said before but it bears repeating to traders now… often times it's the subtle things that can keep you out of trouble, and keep you in a trade you might otherwise want to bail out of. And as is usually the case, we make the point and leave you with plenty to think about by using a real-life example of one of our trades.
Last week, our Grand Slam advisory service [1] took on some Akamai (AKAM) calls, in anticipation of more upside that hadn't exactly been solidified at the time… at least not with a superficial look.
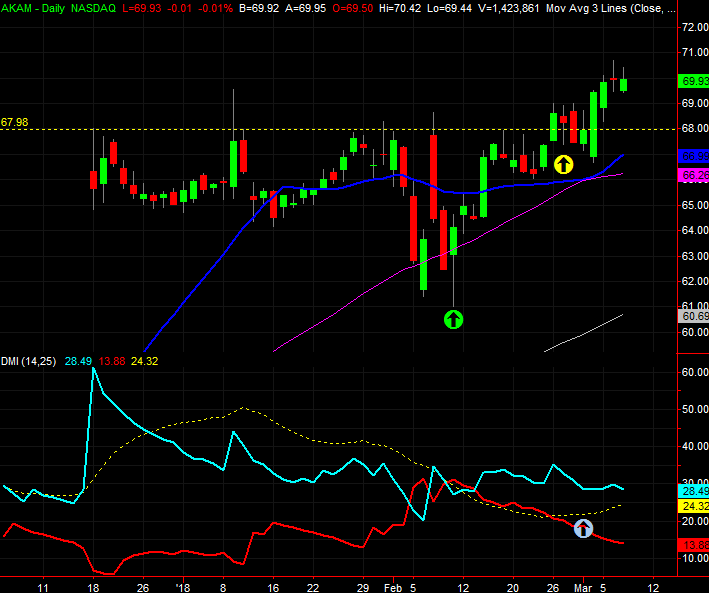
The entry bar is marked with a yellow circled arrow on the chart below. That was February 27th, if you want to follow along more closely on your own charts. The aim was to capture a piece of the breakout above a horizontal resistance line (dashed, yellow) that had been holding the stock back since late last year. It didn't get off to the best of starts, peeling back a little the next day. As you can see now, however, patience paid off. AKAM is well above the former ceiling at $67.98, and still going strong.
 [2]
[2]
Truth be told though, there's for more to this bullish trade than the breakout above a technical ceiling. Indeed, if the only thing we were looking at was a chart of Akamai's daily bars, we probably would have bailed out on March 2nd after a rather nasty open (even though it was more than reversed later on that day).
So why didn't we pull the plug? Two reasons.
First though not foremost, this trade's roots ultimately go back to early February, when we saw a hammer-shaped bar on the 9th, which was the same day we made a new multi-week low. Look for the green circled arrow. The sheer strength of that reversal is telling, and better still, we saw tremendous follow-through. Even though it looked like the bulls were stalling again in the middle of the month as that ceiling near $67.96 was being tested again, the bears never really pushed back; Akamai shares remained above their 20-day moving average line.
Second, and perhaps most important, our DMI (directional movement index) indicator [3]told us to get in this trade on the 27th, and told is to stay in the trade when things were a little hairy a couple of days later.
The short version of a long story. The DMI indicator is a three component tool. The DMI+ line (light blue on our chart) indicates the pace of higher highs for the stock or index in question. The DMI- line (red) indicates the pace of lower lows, though understand that the DMI- line moves higher as the stock or index moves lower. In other words, it's a "strength of the downtrend" measure. You'll notice most of the time, the DMI+ and DMI- lines are moving in opposite directions, as you would expect; higher highs tend to coincide with higher lows, and lower highs tend to coincide with lower lows.
In other words, those two lines are supposed to move in the opposite direction.
The real star of the show here, however, as the ADX line (yellow, dashed) you'll see moving between the DMI+ and DMI- lines.
In simplest terms, the ADX line is a moving average of the difference between the DMI+ and DMI- lines. It smooths out otherwise-erratic data into a useful, trade-prompting trend. In this case, when the ADX line is rising, the uptrend is pretty well confirmed. Conversely, when the ADX line is falling, the downtrend – as suggested by lower lows and lower highs – is also well confirmed. The upward reversal from the ADX line (look for the blue circled arrow) served as a buy signal here. Even when AKAM shares opened bearishly on March 2nd, the ADX line was still pointed upward.
Any one of the three aforementioned clues by themselves probably wouldn't have been enough to prompt an entry into this trade. But, together, they did, and we're glad they did.
The clincher and hero, of course, was the ADX/DMI line combo, which we like largely because nobody else pays much attention to it; you can't do what everyone else is doing and expect to do better than they do. It's also a testament to how sometimes the obscure – not complicated, but obscure – tools are powerful.
For the record, our Grand Slam options trading service looks at more than the ADX/DMI indicator. And, to the extent we do consider the ADX and DMI lines, we don't use the numerical settings you see on the chart above. There's another proprietary nuance we apply to the indicator that we can't even talk about here [we have to have some trade secrets after all]. You get the idea all the same though. This is a wonderful weapon too many people simply ignore, mostly because they don't want to bother learning its vagaries and figuring out how to best use it.
That's fine by us.
If you'd like to "earn as you learn" by receiving Grand Slam trading alerts [1] based on the DMI/ADX tool as well as other proprietary indicators, you can do so by going here [1], or by calling 1-800 BIGTRENDS (1-800-244-8736) to talk to a customer service representative. We also take in-depth looks at the DMI/ADX indicator in our twelve-month coaching course [4], where Price divulges more of our proprietary specifics.