Last week wasn't just another win for stocks. The second consecutive weekly win carried most of the indices just a hair above key technical resistance lines. That's the first step to starting breakouts.
As far as breakout efforts go, this one still fell short of key lines in the sand. We also saw a red flag materialize in terms of sentiment; there's a little too much optimism here, or at least not enough fear.
We'll look at what that means in a moment. First, let's recap last week's most important economic announcements and preview what's coming this week. It's going to be a raucous one, made even more volatile by the beginning of earnings season. Buckle up.
Economic Data Analysis
There was only one item of any real interest last week. And, we didn't even get the whole thing. We only heard the consumer side of inflation on Thursday; the producers' perspective on costs won't be posted until Wednesday of this week. It should be slowing, like consumer inflation is. On balance though, price increases remain relatively strong. The overall consumer rate is a still-high 6.5%, while the core inflation rate (not counting fuel and food) rate is also still high at 5.7%.
Consumer and Producer Inflation Rate Charts
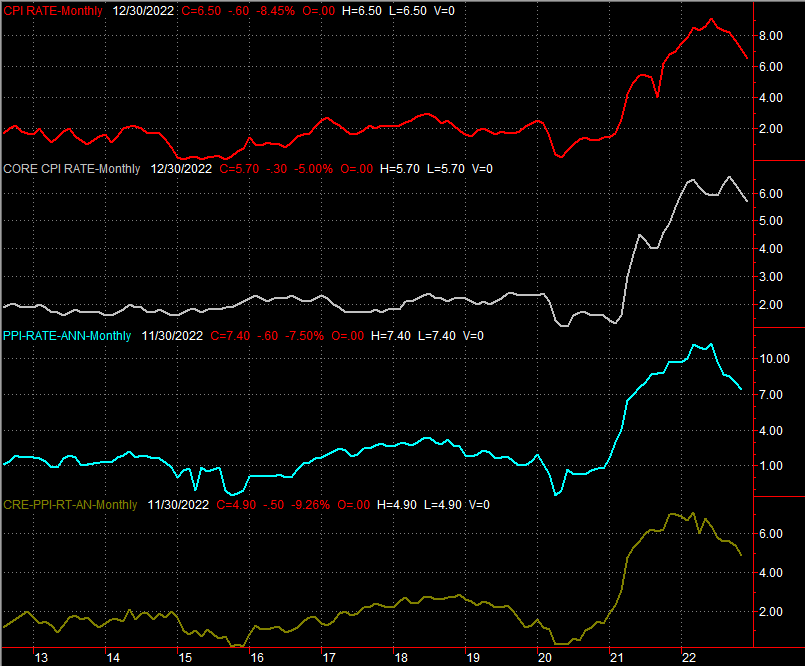 [1]
[1]
Source: Bureau of Labor Statistics, TradeStation
Everything else is on the grid.
Economic Calendar
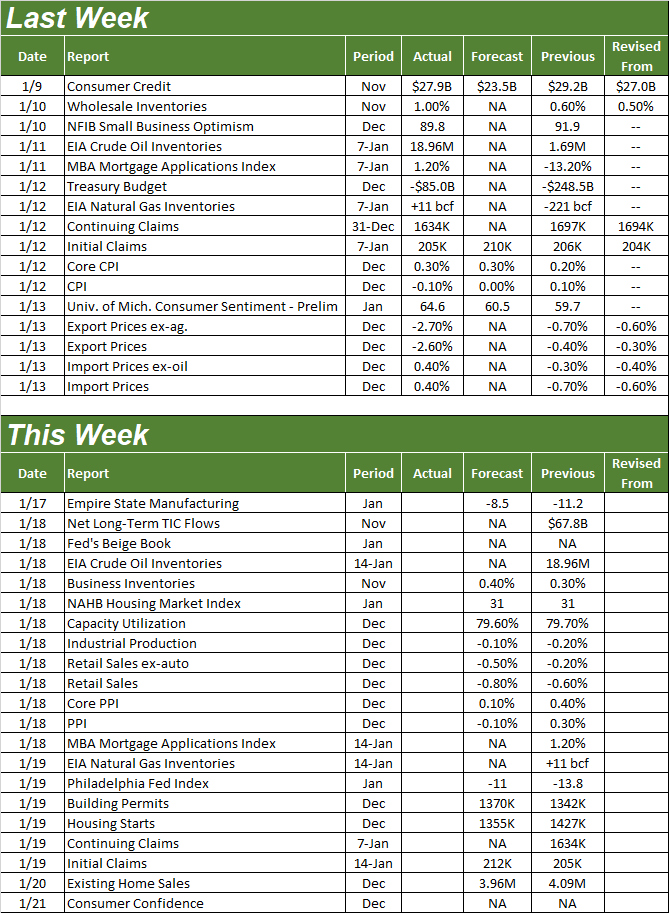 [2]
[2]
Source: Briefing.com
In addition to the producer inflation report, this week is loaded with potentially market-moving data.
The party starts on Wednesday with last month's capacity utilization and industrial production figures. Economists are calling for a slight pullback on both fronts. That wouldn't be an outright disaster, but in light of the fact that both indicators have been less-than-bullish for a few months now, another month of weakness would be more trouble than it seems to be on the surface.
Industrial Production, Capacity Utilization Charts
 [3]
[3]
Source: Federal Reserve, TradeStation
Also on Wednesday we'll hear last month's retail sales. This spending seems to have hit a headwind a month ago, and that slowdown is expected to have worsened in the meantime. This news is an opportunity to re-instill confidence in the economy, but it's also a big risk.
Retail Sales Charts
 [4]
[4]
Source: Census Bureau, TradeStation
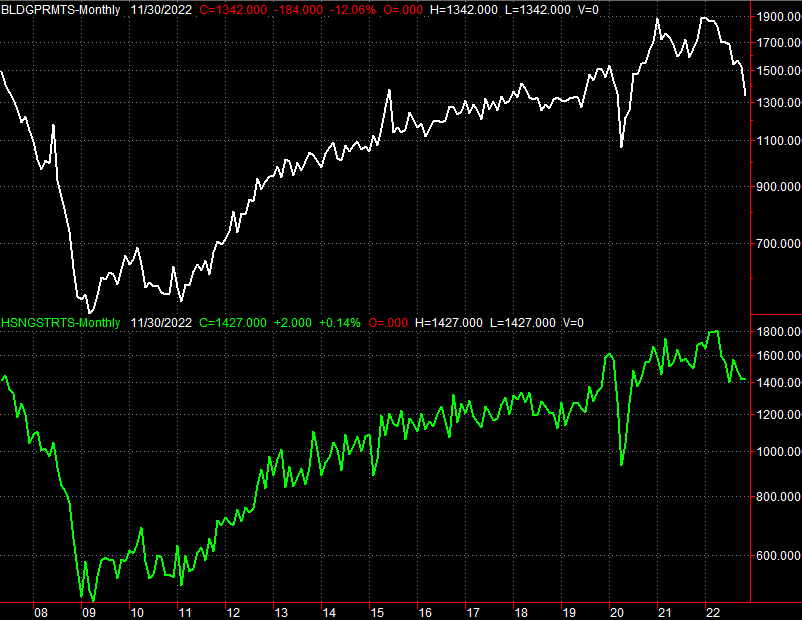
It's also a big week for real estate data.
On Thursday look for December's housing starts and building permits. Permits should be up and starts should be (way) down. Either way, both bigger trends are pointed downward. It's an unsurprising sign that the housing market is indeed falling apart as much as it seems like it is.
Housing Starts and Building Permits Charts
 [5]
[5]
Source: Census Bureau, TradeStation
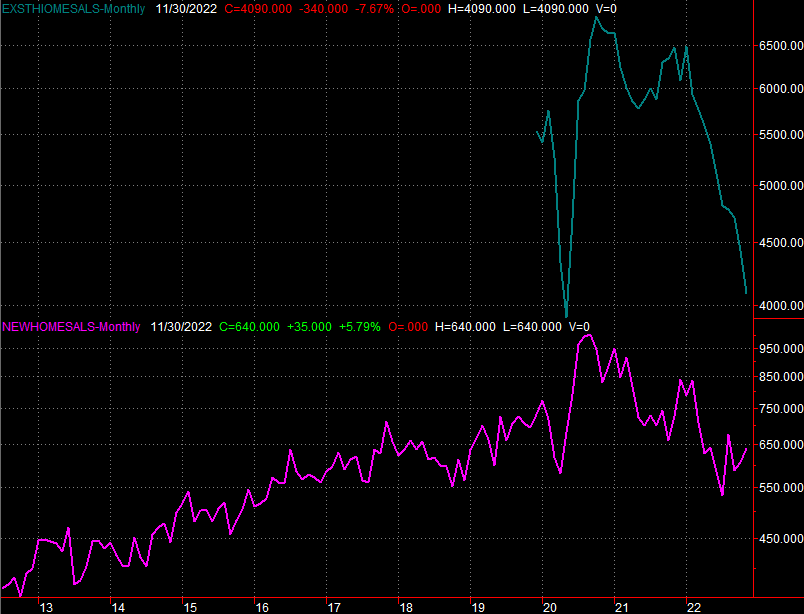
The other real estate report due this week will likely confirm this weakness. That's December's sales of existing homes. They've already cratered, but are likely to fall again — although only a little — for last month.
Home Sales Charts
 [6]
[6]
Source: National Association of Realtors, Census Bureau, TradeStation
Last month's new-home sales data will be released in the following week, though don't expect any different clue. It too should show us waning interest in home-buying.
Stock Market Index Analysis
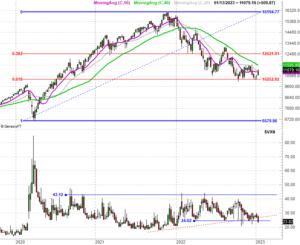
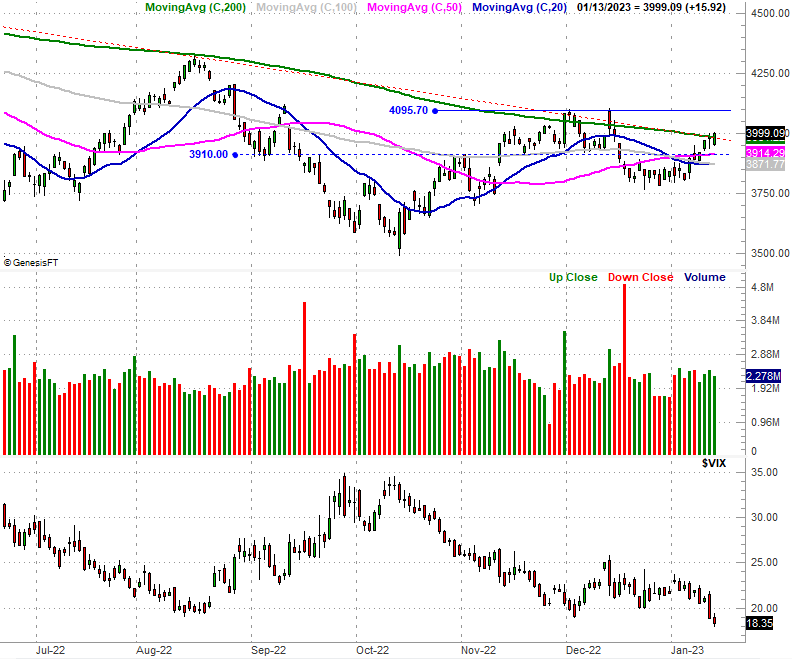
It was a "just barely" kind of victory, but a victory nonetheless. That is, the indices managed to inch their way above key technical resistance lines on Friday. With that, the market is now in bullish mode.
Take a look at the S&P 500 to see. You may have to look closely, but as of Friday the index is above the falling resistance line (red, dashed) that's been pushing it lower since this point last year. At the same time, the S&P 500 is also back above its 200-day moving average line (green). There are no other resistance levels to clear here with the exception of the 4096 area where the index peaked last month.
S&P 500 Daily Chart, with VIX and Volume
 [7]
[7]
Source: TradeNavigator
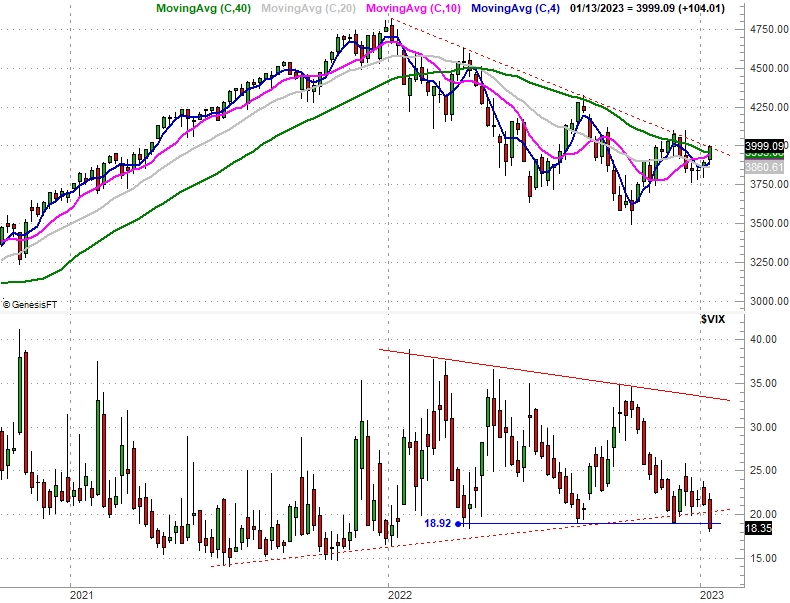
Here's the weekly chart of the S&P 500 for a little added perspective. As you can see from this vantage point, the move above the long-standing resistance line that's kept the downtrend in motion since January of last year really is a very, very slim one that's not evident to the naked eye looking at this image.
S&P 500 Weekly Chart, with VIX and Volume
 [8]
[8]
Source: TradeNavigator
The weekly chart of the S&P 500, however, shows us something else that's perhaps even more interesting. The volatility index (VIX) at the bottom of the chart? It's clearly making lower lows now, by virtue of last week's break under a technical floor around 18.9; it also fell under a rising support line that's been steering the VIX higher since the latter half of 2021. This paradigm shift should signal a major change in the market's true undertow.
The daily chart of the NASDAQ Composite looks similar, although not identical. The NASDAQ punched back above its 100-day moving average line (gray) on Friday, but is not yet above what will be a major technical ceiling around 11,550… where the 200-day line (green) will soon be. And, the NASDAQ Composite's Volatility Index (VXN) broke under a major technical support level at 24.6 as well.
NASDAQ Composite Daily Chart, with VXN
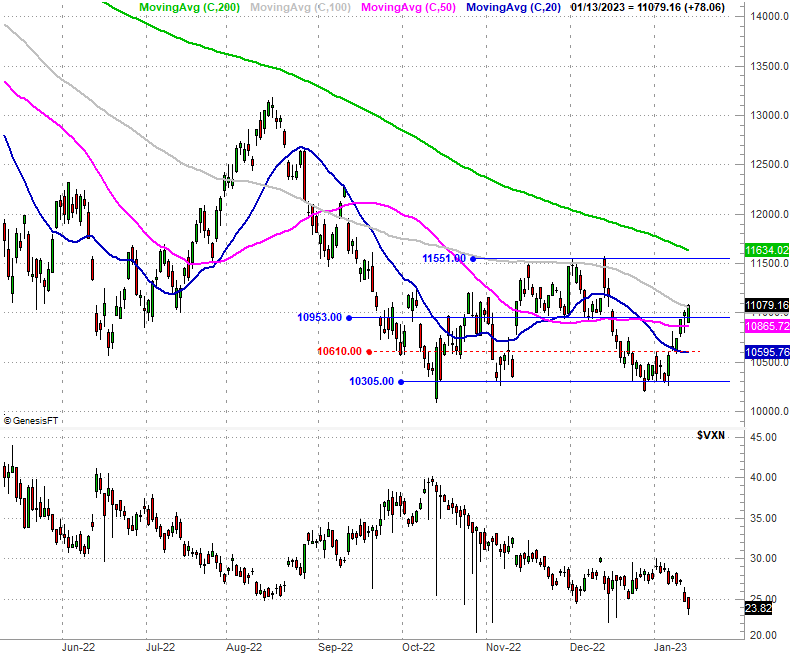 [9]
[9]
Source: TradeNavigator
The weekly chart, however, makes sense of everything we're seeing now. The bounce the NASDAQ chart has dished out over the course of the past three weeks is indeed the result of support at a major Fibonacci retracement line. In that this is the second time we've seen this level serve as a floor around 10,250, we have to take it seriously.
NASDAQ Composite Daily Chart, with VXN
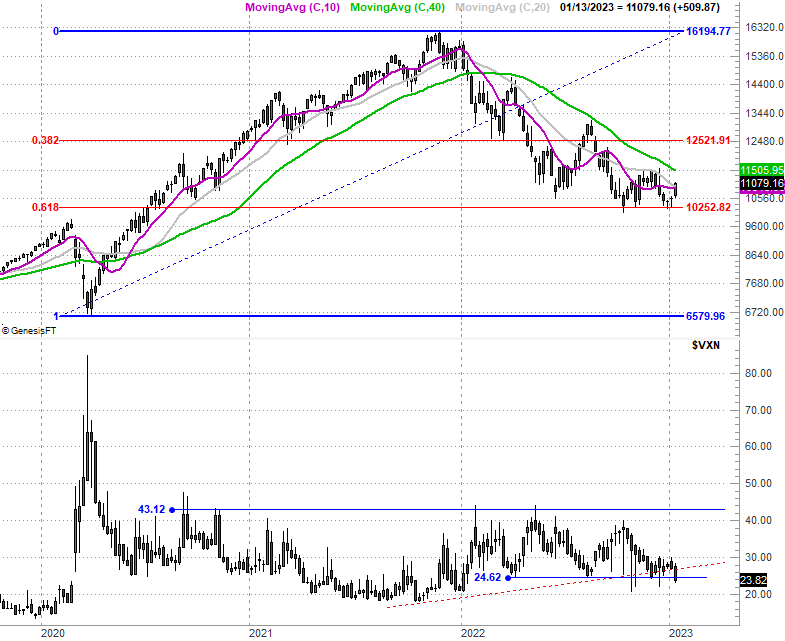 [10]
[10]
Source: TradeNavigator
This doesn't guarantee the market will continue rallying. It does certainly up the odds of that happening though, even if the bulls have to take a small step back first and restart the effort for better effort the next time around. The only problem? While the volatility indexes both dropped bullish hints last week, they're also both at or near absolute lows that don't leave a whole lot of room for more downside that would coincide with market gains. Keep on eye on that not-so-small detail going forward.