
It wasn't the sort of a beginning of a bounce we normally like to see. Namely, the market left behind bullish gaps on Thursday and traveled a little too far, too fast. It certainly beats the alternative though. The trick will be letting stocks cool off a bit — and maybe even pull back a bit — without undermining the new, still-fragile uptrend. Some key technical ceilings were knocked over.
We'll look at the breakout effort in a moment below. Let's first run through last week's most important economic announcements and preview what's coming this week.
Economic Data Analysis
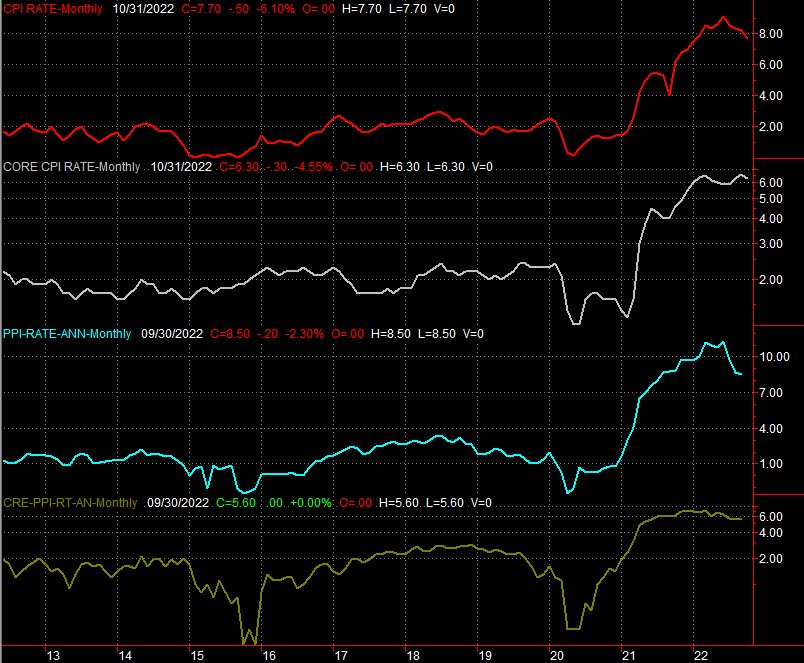
There's really only one item from last week of any real interest. That's inflation… or half the inflation picture anyway. On Thursday we heard last month's consumer inflation report. It's still high, but the annualized inflation rate of only 7.7% is much lower than expected. It's also the lowest since early this year. Core inflation (not counting food and fuel) also saw a notable drop.
Inflation Rate (Annualized) Charts
 [1]
[1]
Source: Institute of Supply Management, TradeStation
Curbed inflation pressure is of course the big driver of last week's gains. Investors are interpreting the lull as a sign that prices will continue to fall, which works in the market's favor. And, maybe traders are seeing things in the correct light. Price increases are still uncomfortably high though, and may yet prod economic weakness.
We'll round out the inflation picture this week with Tuesday's look at October's producer inflation. Analysts are looking for a slight increase of the price increase pace's growth despite the lull in consumer price increases. Take the hint – inflation is still pretty brisk.
Everything else is on the grid.
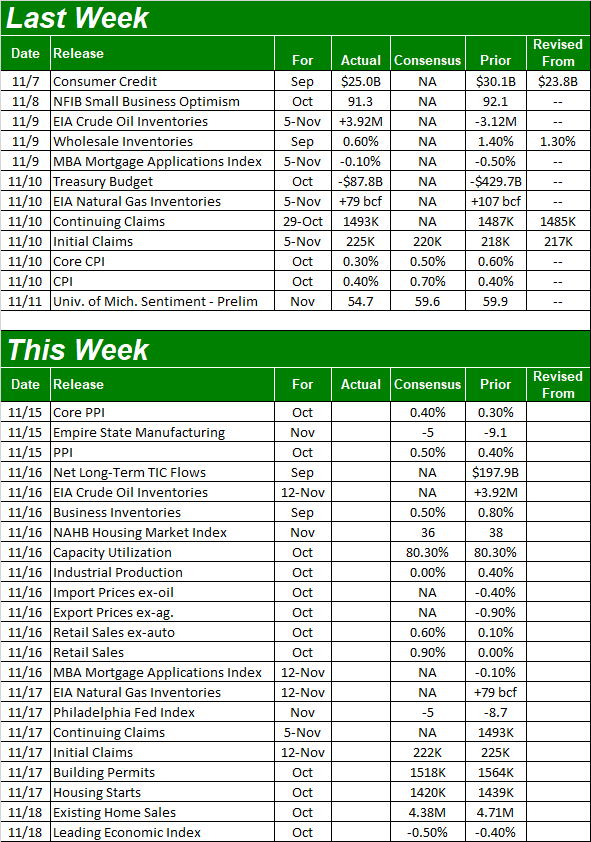
Economic Calendar
 [2]
[2]
Source: Briefing.com
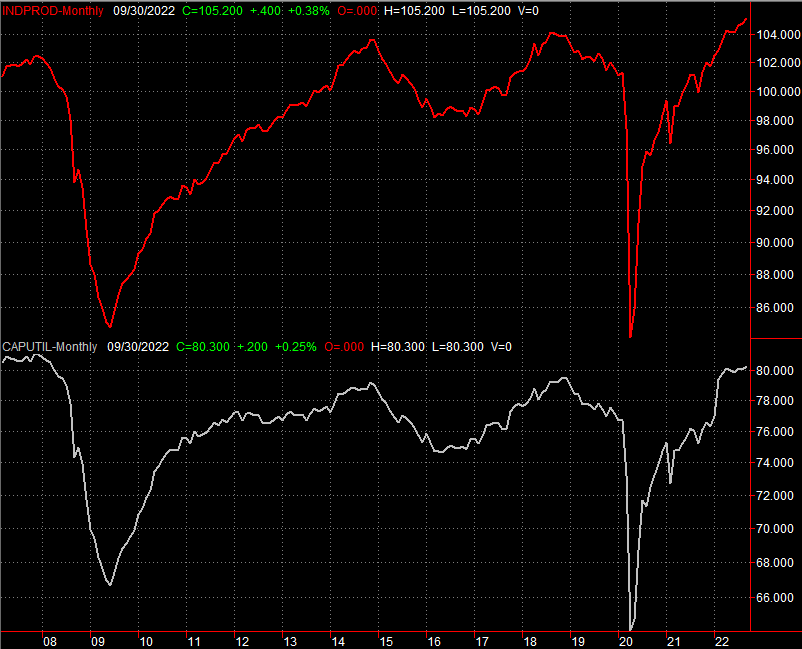
In addition to Tuesday's producer inflation report, look capacity utilization and industrial productivity data on Wednesday. Production has been on the rise, and while capacity utilization has leveled out at around 80%, that's in-line with the long-term maximum. Economists believe productivity stalled last month all the same, however, at least hinting of an economic headwind. It's still far too soon to sweat it though.
Capacity Utilization and Industrial Productivity Charts
 [3]
[3]
Source: Federal Reserve, TradeStation
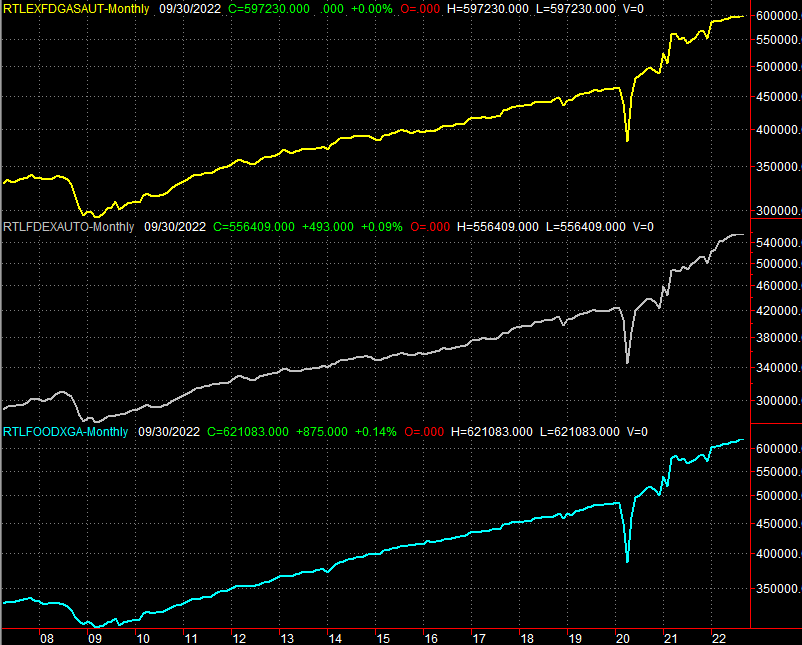
Last month's retail sales report will also be posted on Wednesday. Spending growth has slowed to a crawl of late, with inflation curbing consumerism. Forecasters are calling for a significant increase in retail sales for last month though. This report can move the market, for better or worse.
Retail Sales Charts
 [4]
[4]
Source: Census Bureau, TradeStation
October's housing starts and building permits figures will be released on Thursday, and are widely expected to show slight declines from September's already-poor numbers.
Housing Starts and Building Permits Charts
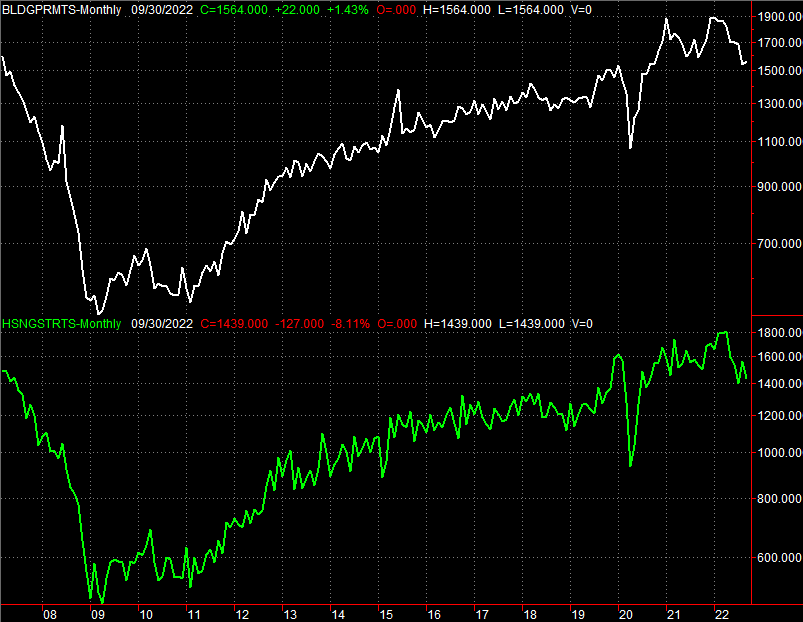 [5]
[5]
Source: Census Bureau, TradeStation
That won't be the last look at real estate market though. Look for existing home sales on Friday. Not surprisingly, analysts are calling for another dip here as well, pushing sales to the lowest level since the pandemic's arrival in the United States in early 2020.
Home Sales Chart Charts
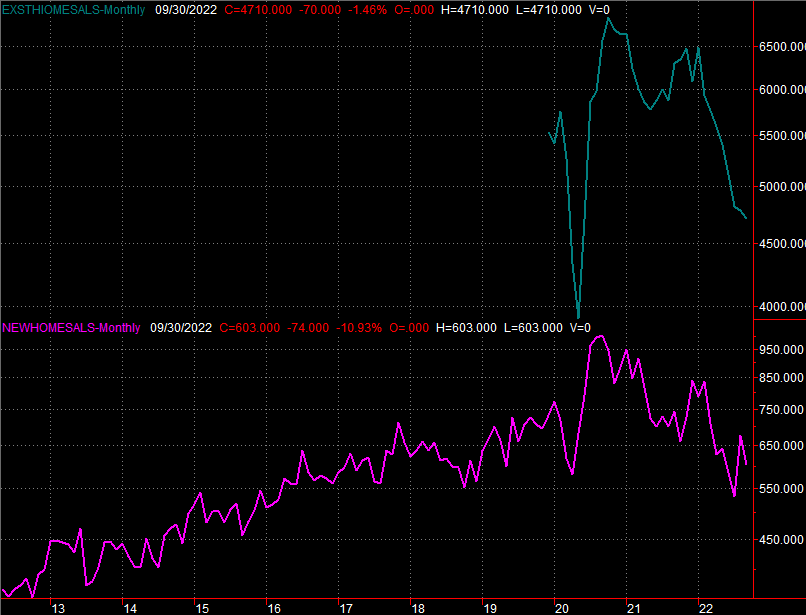 [6]
[6]
Source: National Association of Realtors, Census Bureau, TradeStation
Last month's new home sales report won't come out until next week. Given all the other real estate data we've seen of late though, it's a good bet its downtrend will remain in place.
Stock Market Index Analysis
There's no two ways about it – last week was a win for the bulls. Every index managed to hurdle at least one critical resistance level. Take the NASDAQ Composite for instance. Pushing up and off of its 61.8% Fibonacci retracement line at 1028, the index punched through the ceiling at 11,228 where it has peaked a couple of times since early October. The move also carried the composite above the 50-day moving average line (purple) at 11,104, even if that line hasn't meant a whole lot for the NASDAQ of late.
NASDAQ Composite Daily Chart, with VXN
 [7]
[7]
Source: TradeNavigator
The Dow's victory came in the form of a move above the resistance line that had connected all the key highs going back to January. The move also pushed the Dow Jones Industrial Average well past its 200-day line (green).
Dow Jones Industrial Average Daily Chart, with Volume
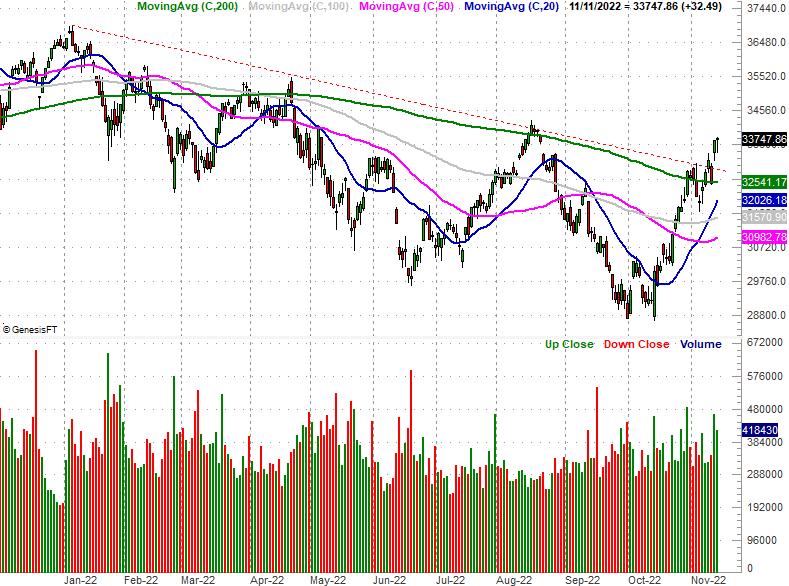 [8]
[8]
Source: TradeNavigator
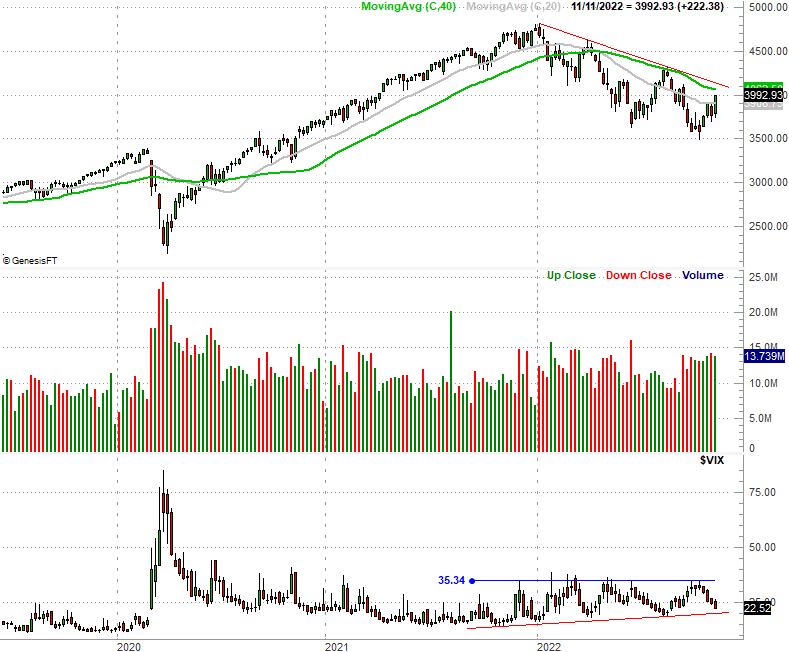
The S&P 500's bullish move, while effective, was also the last impressive. Last week's gain of 5.9% got the index above its 100-day moving average line (gray) at 3904.6, but there's a bigger technical ceiling waiting for it at 4112… the line connecting the major peaks since January (red). Note this straight-line is rather well entwined with the 200-day moving average line (green), making each of them more important ceilings than they might be on their own.
S&P 500 Daily Chart, with VIX and Volume
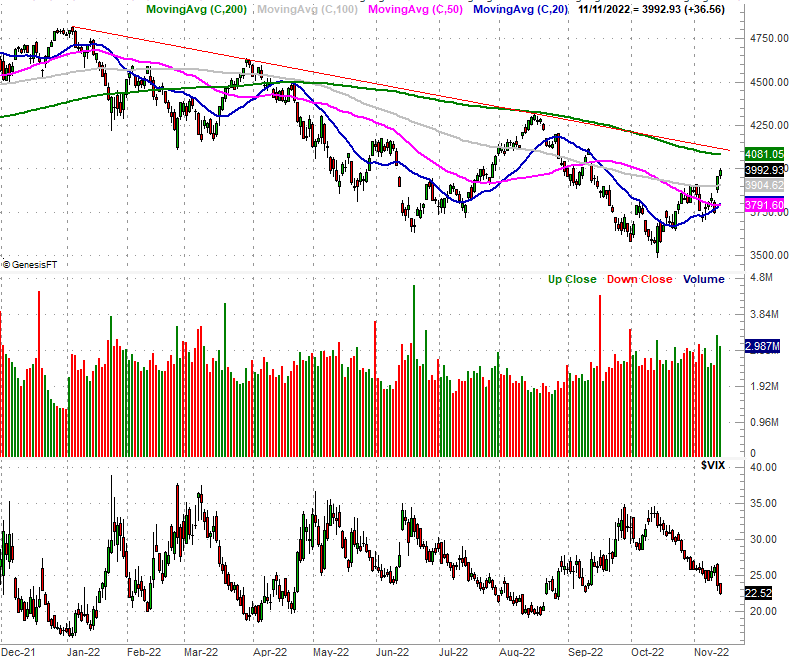 [9]
[9]
Source: TradeNavigator
What do we make of it all? As was noted, the interpretation here has to be a bullish one. All of the indices made good bullish progress last week, and this is a bullish time of year anyway.
That's a cautious bullishness though, as the market remains even more prone to headfakes (and fakeouts) than usual right now. There are still plenty of things that could up-end the rally effort.
To best spot these potential hazards we back out to the weekly charts. Check out the weekly chart of the NASDAQ for this additional perspective. While it bounced last week, it was just that… a bounce. It's not yet a full-blown rebound, and there's still lots of resistance above that could still easily quell this effort before it gets going in earnest. The 100-day and 200-day moving averages as well as the 38.2% Fibonacci retracement level at 12,536 could all halt the rally.
NASDAQ Composite Weekly Chart, with VXN
 [10]
[10]
Source: TradeNavigator
Here's the weekly chart of the S&P 500, with that big technical resistance still showing. What's worth noting on this chart, however, isn't the S&P 500 as much as its Volatility Index, or VIX. In step with the market's rise, the VIX continues to inch lower. But, the VIX is nearing a key floor of its own just as the S&P 500 approaches major ceilings.
S&P 500 Weekly Chart, with VIX and Volume
 [11]
[11]
Source: TradeNavigator
It's going to be tough for the market to get past the levels it hasn't worked past yet. Don't be surprised to see the rally effort stall when-and-if-this resistance (or for the VIX, support) is met. More to the point, don't read too much into this new bullishness, even if it's been so seemingly strong for most of the past four weeks.