
Weekly Market Outlook – Things Just Got a Lot Tougher For The Bulls
Weekly Market Outlook – January 12th, 2025
For a brief moment early last week, it looked like the market just might escape suffering a full-blown correction and rekindle its bigger-picture. But, no such like. By Friday’s close, the market was in worse shape than it was as of the end of the previous week.
That still doesn’t mean stocks are past the proverbial point of no return, however. They’re close, but not quite there. It would take one more good sucker-punch to push the market over the edge and into a more serious correction.
We’ll look at where we are in a second. First, let’s hear last week’s economic news and discuss what’s in the lineup for this week.
Economic Data Analysis
It was a relatively light week, but we did get a couple of important data nuggets.
The first of these is Tuesday’s ISM Services Index update from the Institute of Supply Management. It improved, and even more than expected, growing to a strong reading of 54.1. Notice that the ISM Manufacturing Index is also firmly on the rise now, with both indexes seemingly at least starting to come out of their recent funks.
ISM Manufacturing, Service Index Charts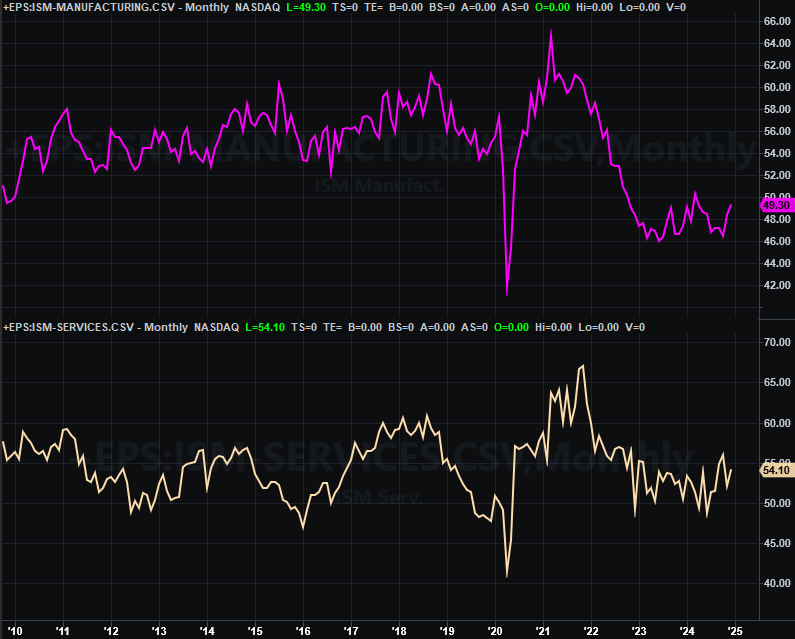
Source: Institute of Supply Management, TradeStation
The only other item of real interest was December’s jobs report posted on Friday. It was pretty solid too… although perhaps too solid. The unexpectedly high print of 256,000 new payrolls (versus expectations of only 155,000) is also a measurable improvement on November’s count of 212,000, and enough to drag the unemployment rate down from 4.2% to 4.1%. Even so, it’s difficult to say either data set is firmly trending in a convincingly-bullish direction.
Unemployment Rate, Payroll Growth Charts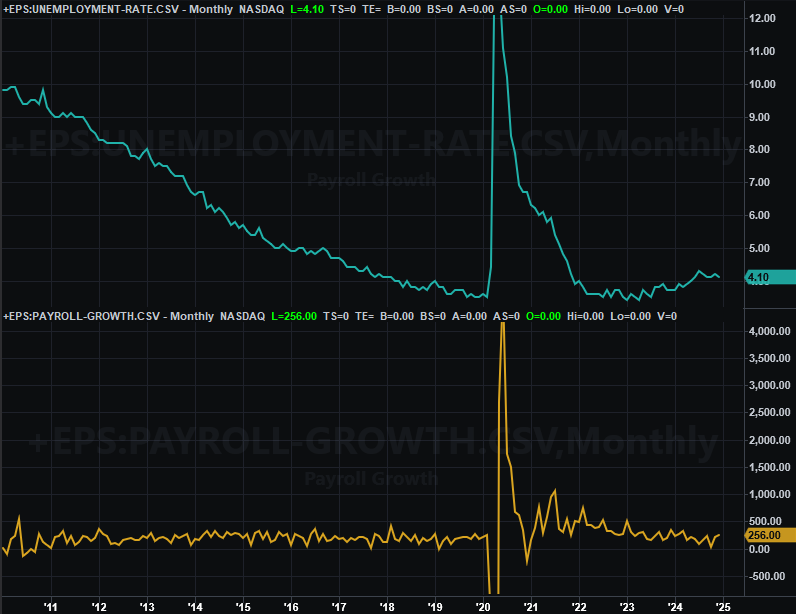
Source: Bureau of Labor Statistics, TradeStation
This wasn’t necessarily the only prompt for Friday’s setback, although it certainly contributed to it. A robust jobs/employment market fuels inflation, and potentially pushes future interest rate cuts further down the road. That’s the dots traders were connecting on Friday anyway.
Everything else is on the grid.
Economic Calendar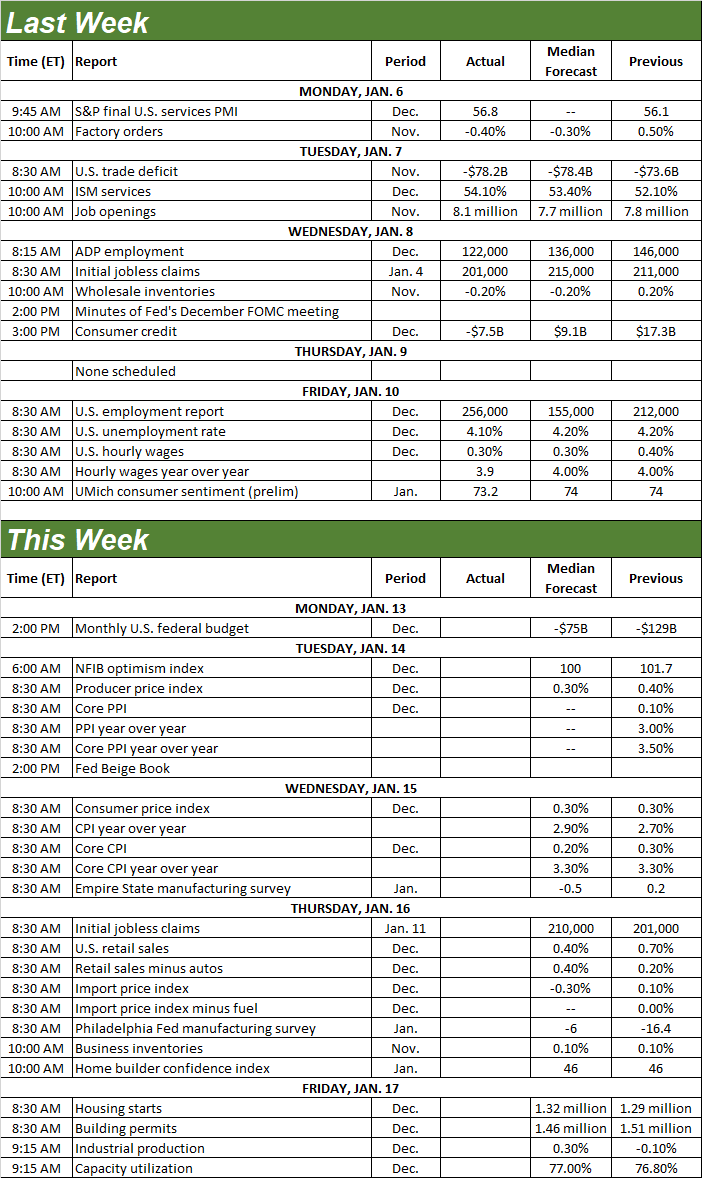
Source: Briefing.com
This week is going to be much busier, kicking off with producer inflation on Tuesday and then consumer inflation on Wednesday. Both are expected to inch a little higher again, but only a little.
Producer, Consumer Inflation Rate Charts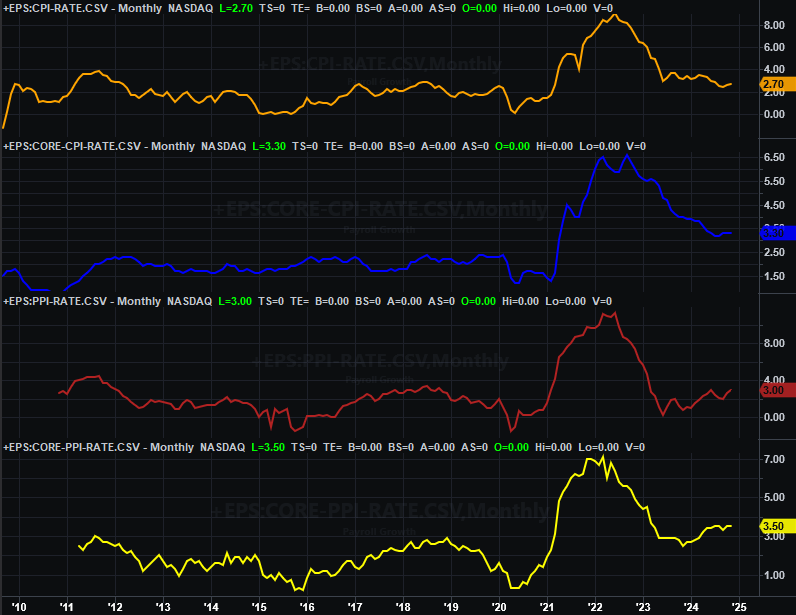
Source: Bureau of Labor Statistics, TradeStation
If a strong jobs market is supposed to fuel inflation, it’s not measurably happening yet.
Look for last month’s retail sales on Thursday. They should be up as well, extending a recent upward acceleration on most consumerism fronts.
Retail Sales Charts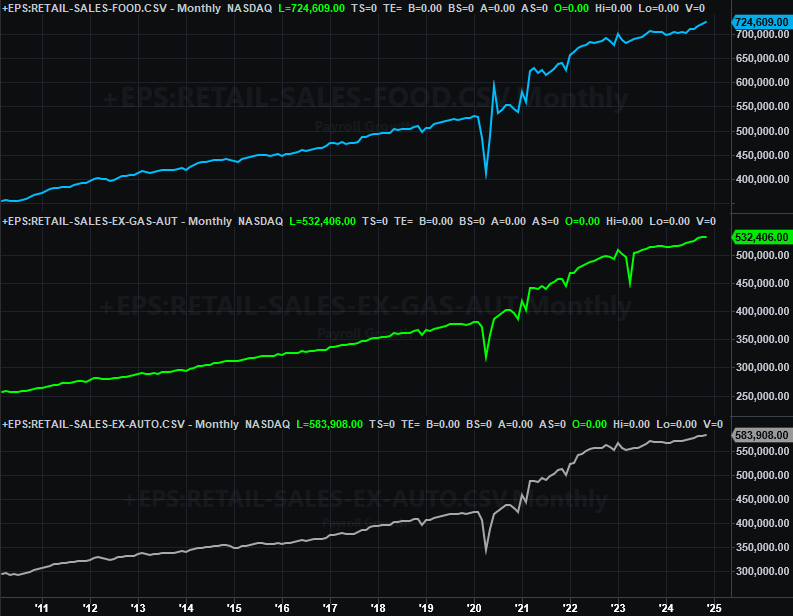
Source: Census Bureau, TradeStation
On Friday we’ll get December’s housing starts and building permits… no real progress expected on either front. And, we’ve not seen much change from either data set since both imploded in 2022. Affordability continues to prove problematic.
Housing Starts and Building Permits Charts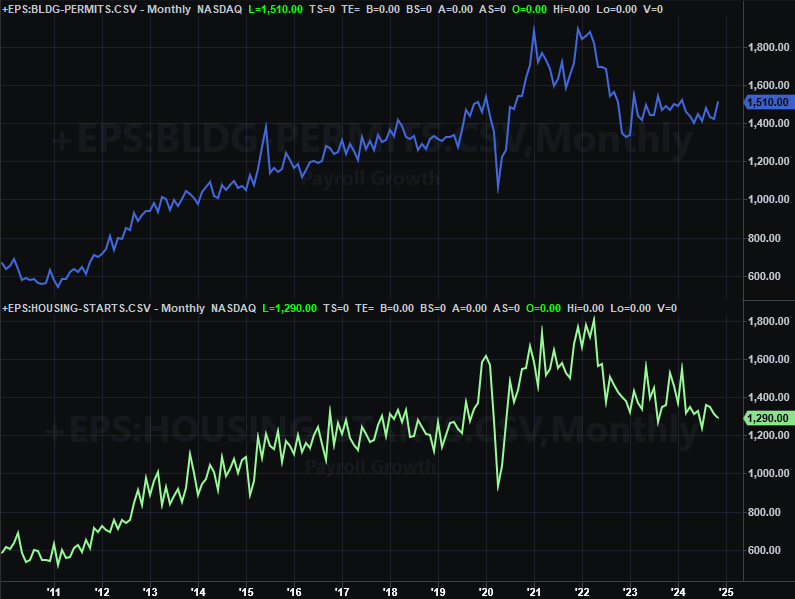
Source: Census Bureau, TradeStation
While we’re not charting it here, also know that we’ll be hearing last month’s capacity utilization and industrial production numbers on Friday of this week.
Stock Market Index Analysis
Buckle up. This is going to be a wild one.
First and foremost, yes, the market took a pretty damaging hit last week, falling under a handful of important support lines. Conversely, there’s still room and reason for a rebound taking shape sooner than later. That ball’s now in the bulls’ court though, and they’re on the defensive.
We’ll kick things off this week with a look at the weekly chart of the NASDAQ Composite simply because we need to go into the more detailed daily analysis with the proper mindset and perspective. Take a look. Although the composite ended up making another lower low and closing at the lowest weekly close since late November, the index is still well inside a rising, long-term trading range. In fact, it’s still nearer the upper boundary of this channel than the lower boundary.
NASDAQ Composite Weekly Chart, with VIX and MACD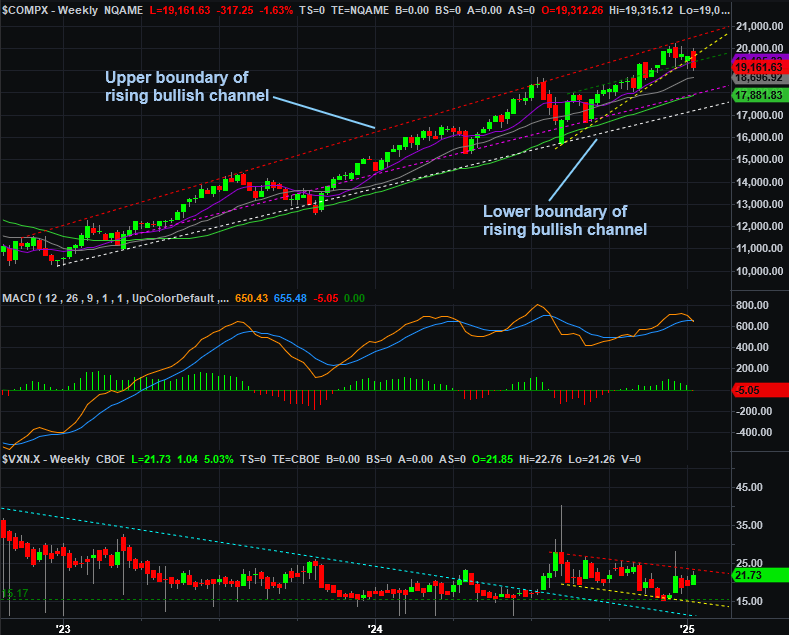
Source: TradeNavigator
Also notice, however, the NASDAQ’s volatility index (VXN) is once again knocking on the door of a technical resistance line currently near 22.0 (red, dashed).
Here’s the daily chart of the composite. As you can see, it’s been steered lower of late by a falling resistance line. It also broke below recent lows (and now-former) horizontal support) at 19,140, as well as fell under its 50-day moving average line (purple) at 19,319. Clearly the mood’s changing for the worst, even of the bears haven’t yet been able to dish out a knockout punch.
NASDAQ Composite Daily Chart, with VXN and Volume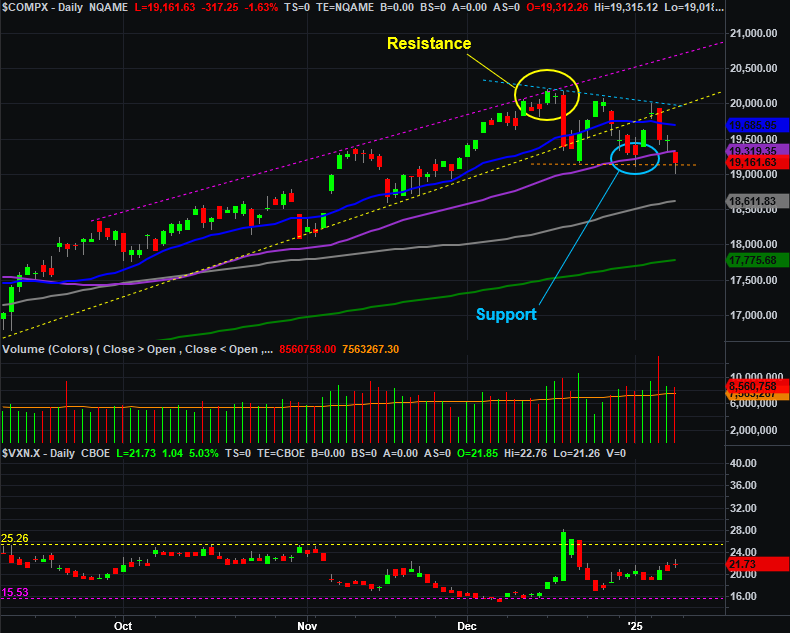
Source: TradeNavigator
Although not identical, the weekly chart of the S&P 500 looks similar enough to the NASDAQ’s that we won’t bother showing it here. We’ll instead dive right into the daily chart. As you can see, it too briefly broke under recent horizontal support at 5,827 (purple, dashed), but it along with the 100-day moving average line (gray) currently at 5,820 seem to have jointly stopped the selling… at least for now. With the 20-day moving average (blue) having just crossed below the 50-day line (purple) though, the undertow is more bearish than it seems on the surface.
S&P 500 Daily Chart, with VIX and Volume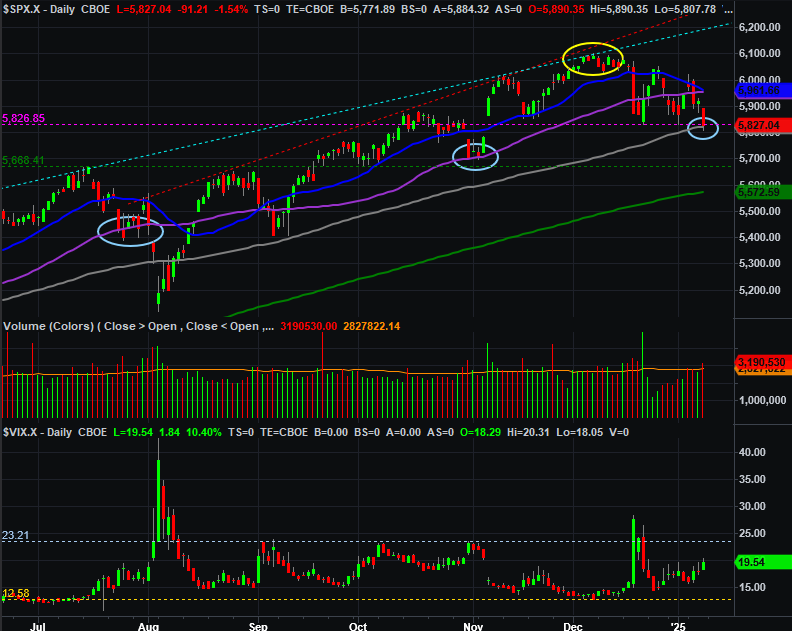
Source: TradeNavigator
Underscoring this bearish argument is the market’s breadth and depth. That is to say, it’s up and down volume and its advancers and decliners. As the trend lines of the NYSE’s “up” volume (UVOL), “down” volume (UVOL), advancers (ADV) and decliners (DECL) below show us, breadth (advancers versus decliners) turned bearish in early December, and hasn’t been this net-bearish in months.
S&P 500 vs. NYSE Up/Down Volume and Advancers/Decliners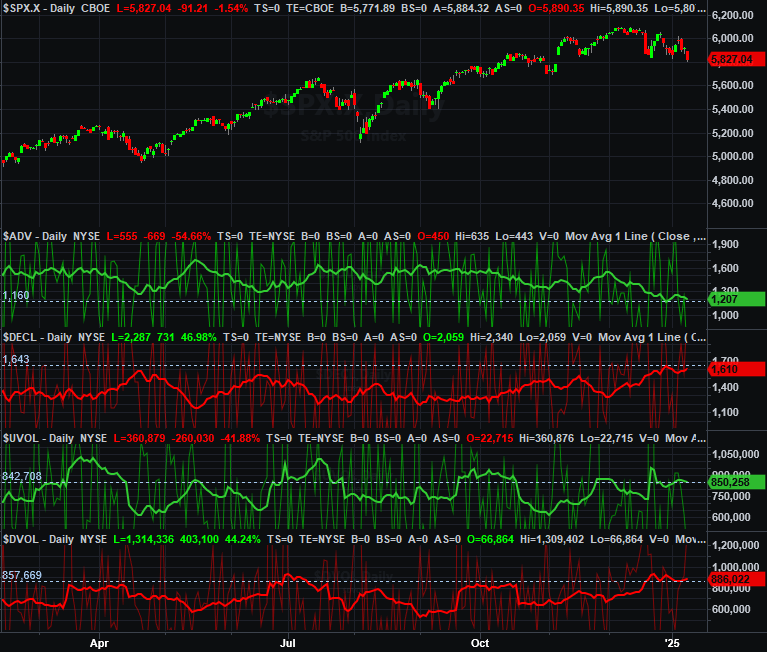
Source: TradeNavigator
The more-erratic up and down volume trends are also at least leaning in a bearish direction.
So now what? The market’s got one last chance — or bastion of hope — of sidestepping a true corrective move. Both indexes are at or even under their proverbial breaking points. The bulls might make one last push, but don’t be convinced that a turnaround is in the cards. It could take two or three days at these pivotal levels for one side or the other to flinch.
That being said, a more significant correction wouldn’t necessarily be the end of the world. The S&P 500 is only down a little more than 4% from January’s peak. That’s not much, and certainly not enough to hit the proverbial “reset” and let stocks move higher unencumbered. A tumble all the way back to the 5,600-ish area where the 200-day moving average line currently is would do the trick nicely, without forcing the market into an outright nosedive.
Unfortunately for the near-term, that’s increasingly looking like what’s in the cards.