And just like that, what looked like a recovery effort came to a screeching halt. The previous week's 6.6% gain was halted in its tracks last week, ceding to weakness that ultimately dragged the S&P 500 1.2% lower for the four-day-trading-day stretch.
It's not necessarily the end of the world. That 6.6% advance was a tough act to follow. The bulls just may be taking a breather. A key market indicator suggests traders are still thinking bullishly even if not overtly acting so. We just would have liked to have seen a little more bullishness so soon following the initial recovery move.
We'll get into the particulars in a moment. First, let's recap the economic reports that are largely the cause of last week's slowdown. It looks as if there's room and reason for the Federal Reserve to keep raiding interest rates after all.
Economic Data Analysis
Despite pessimism to start the week, most of last week's economic news was more optimistic than not. The grand finale of course was a pretty solid jobs report on Frida. But, first things first. In order of appearance…
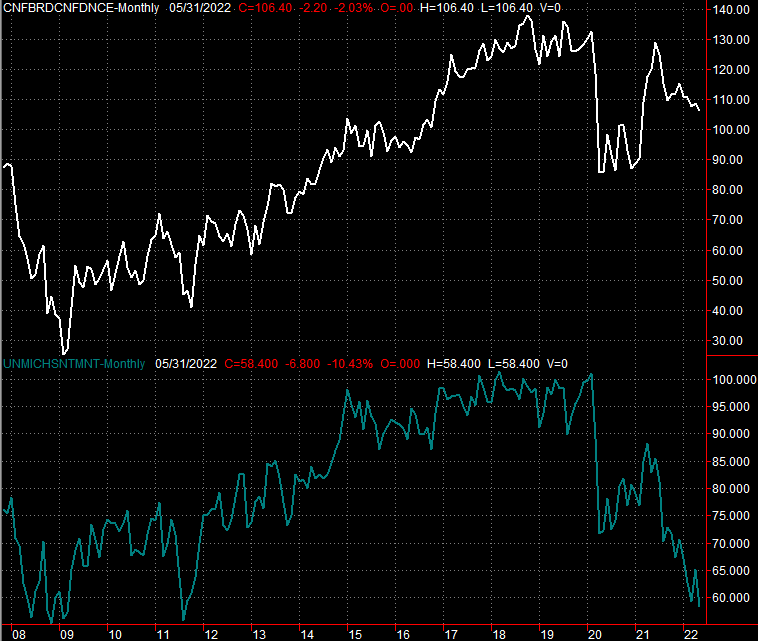
Consumer confidence is down, although not as much as expected. The Conference Board's measure on the matter ticked a little lower last month, though came in notably higher than expected. The University of Michigan's sentiment index for May, however, not only fell, but fell to a multi-year low.
Consumer Sentiment Charts
 [1]
[1]
Source: University of Michigan, Conference Board, TradeStation
It's not terribly surprising. The two polls look at different things, and weigh things differently. Still, the fact that both are still inching lower illustrates the bigger worry.
It was also a big week for real estate data. Rounding out a slate of real estate numbers is the FHFA Housing Price Index and the S&P Case-Shiller Index, both for March… a time before interest rates, mortgage rates, sentiment, and the market all went haywire. The pricing data was rock-solid, though bear in mind it only considers the prices of sold homes. Actual purchases — transactions — are still slowing. It's possible that average home values for sold real estate is inching higher only because the higher-end market is the only sliver of the market that's still drawing interest.
Housing Price Charts
 [2]
[2]
Source: Standard & Poor's, FHFA, TradeStation
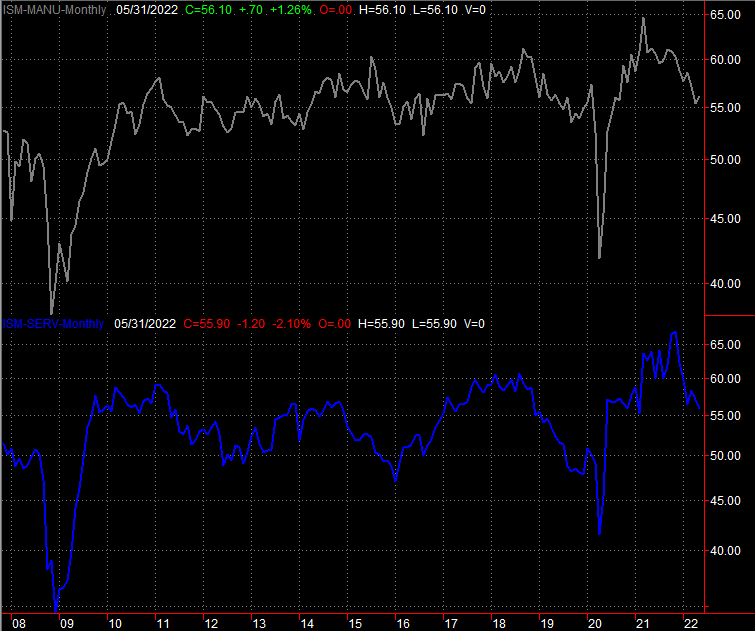
Whatever the case, the overall economy still seems to be humming. Take the ISM Indices as an example. The manufacturing index defied expectations by ticking even higher, and while the services index edged a little lower, both are still above the critical 50 mark the separates growth and contraction.
ISM Index Charts
 [3]
[3]
Source: Institute of Supply Management, TradeStation
Last week's biggie, of course, was last month's payroll growth report. Economists were only expecting growth of 325,000 new payrolls, but we got 390,00 instead. Yes, the unemployment rate came in at 3.6% again rather than falling to 3.5%. But, that's mostly got to do with the fact that a bunch of people unexpectedly jumped back into the job market, though didn't necessarily secure a job.
Payroll Growth and Unemployment Rate Charts
 [4]
[4]
Source: Bureau of Labor Statistics, TradeStation
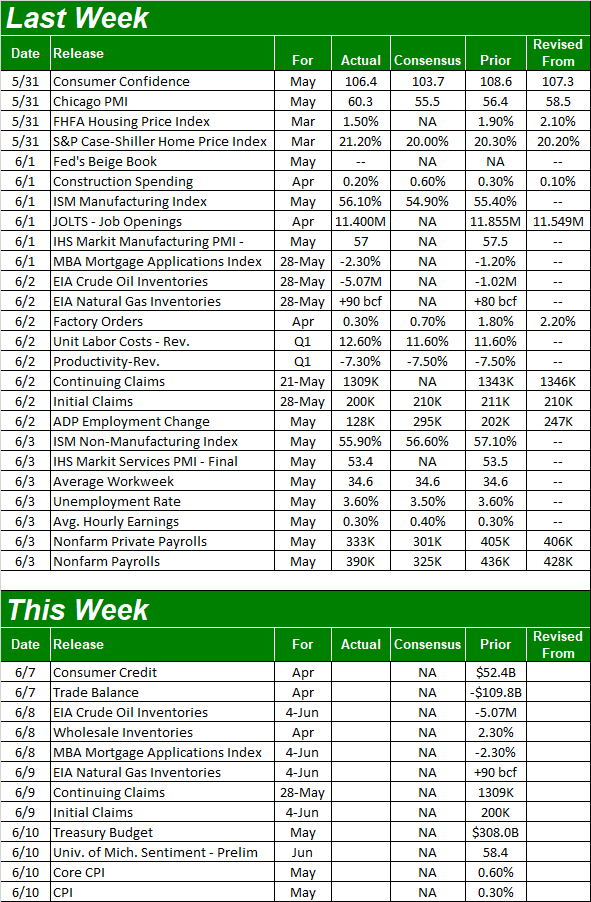
Everything else is on the grid.
Economic Calendar
 [5]
[5]
Source: Briefing.com
This week is going to be light. In fact, the only item of any real interest in the lineup is Friday's look a consumer inflation. Estimates aren't out yet, but odds are good it'll be a big number again. As of the latest tally the overall consumer inflation rate stands out.
Consumer and Producer Inflation Rate Charts
 [6]
[6]
Source: Bureau of Labor Statistics, TradeStation
The producer inflation report won't be out until next week.
Stock Market Index Analysis
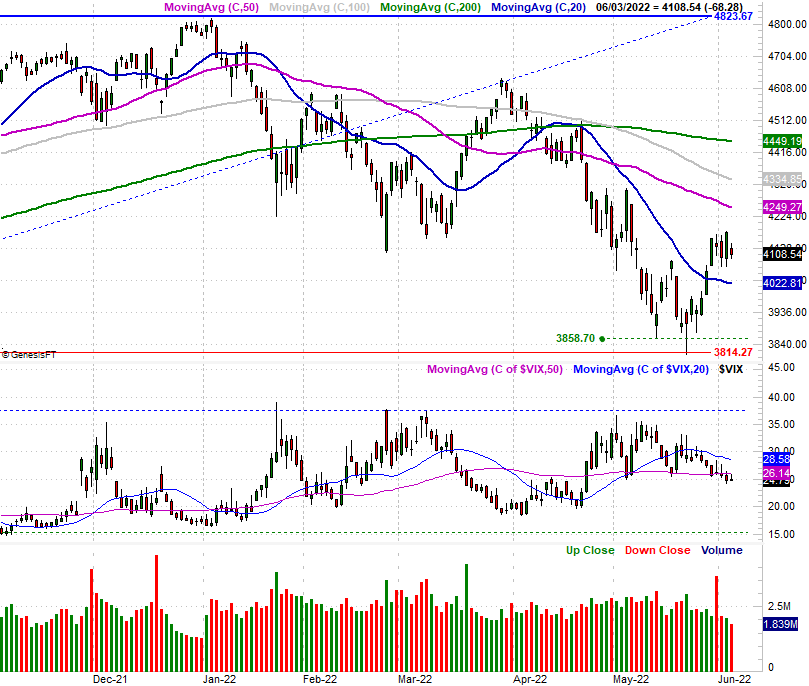
Indecision. That's the only word to describe last week's action. Though firmly bullish the week before, traders mostly changed their mind last week. Things were wildly bullish on Thursday… sure. Thank the rhetoric from that day, which loosely suggested the Fed may not be quite as aggressive with its rate-hike plans as it was just a few weeks ago. (Stocks are really, really struggling with the prospect.) That hope faded pretty quickly again on Friday though, allowing stocks to slip back into the red for the week. Here's the daily chart of the S&P 500, telling the whole story.
S&P 500 Daily Chart, with VIX and Volume
 [7]
[7]
Source: TradeNavigator
The lack of net movement is underscored by the lack of — and shrinking — volume, although this nuance really underscores the idea that traders are undecided here about what's coming next. Since nobody knows what to expect, nobody's doing much of anything for more than a day.
Still, the bulls have to like the fact that the S&P 500's Volatility Index (VIX) continues to inch its way lower. This is a sign that traders are still thinking, positioning, and hedging bullishly even if stocks themselves aren't actually moving higher.
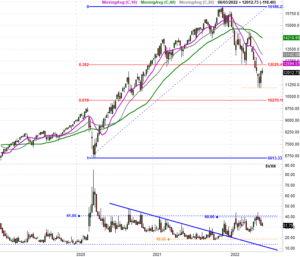
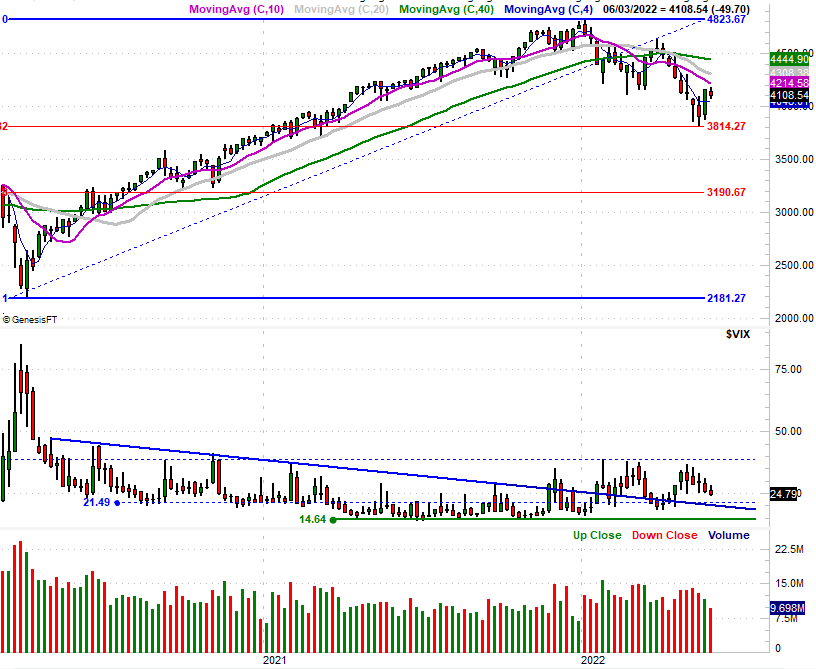
It's also possible the sheer scope of the big jump from two weeks ago meant there was no real room to keep rallying this soon; the buyers may have needed a breather. The weekly chart of the S&P 500 below puts that big jump into perspective. The weekly chart also reminds that the low from three weeks back was ultimately all about the 38.2% Fibonacci retracement line at 3814, which is a technical floor when there's no other technical floor around.
S&P 500 Weekly Chart, with VIX and Volume
 [8]
[8]
Source: TradeNavigator
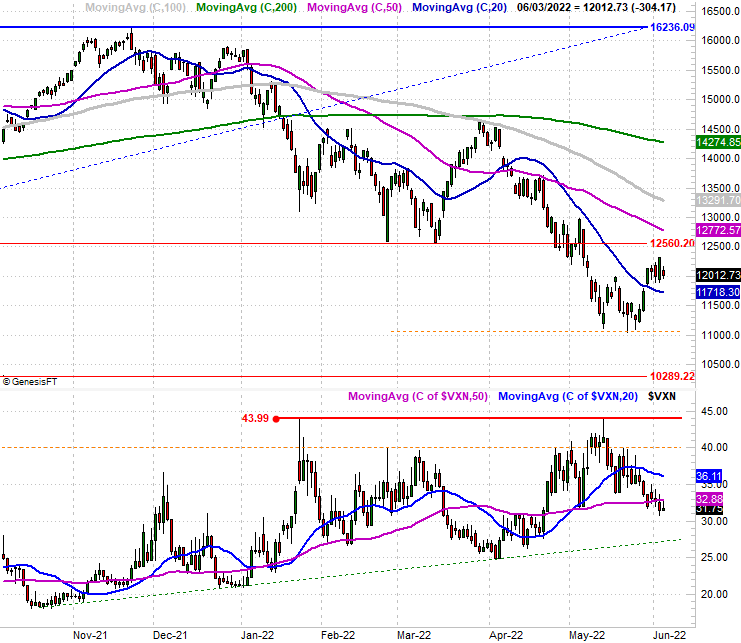
The daily chart of the NASDAQ Composite looks more or less the same. That is, after a big move two weeks back, the effort petered out last week. The NASDAQ's Volatility Index is still pointed downward though, suggesting traders feel more bullish then bearish about what lies ahead.
NASDAQ Composite Daily Chart, with VXN
 [9]
[9]
Source: TradeNavigator
And, the weekly chart of the composite just to point out that the NASDAQ's bottom from three weeks ago had nothing to do with a Fibonacci level. It was instead simply the result of finding a pretty decisive floor around 11,015 (dashed) for three weeks in a row. The weekly chart also shows us there's a fair bit of room for the NASDAQ's Volatility Index to keep falling before bumping into a floor.
NASDAQ Composite Weekly Chart, with VXN
 [10]
[10]
Source: TradeNavigator
This has been a difficult market environment to navigate, and last week's action didn't help one iota. Most everyone is shooting from the hip, but the undertow is changing on a near-daily basis as the headlines do… which are changing their messaging too. Some economic data and earnings reports are encouraging, but others aren't. It's confusing for everyone
Here's what we do know though… trading is very much a day-by-day endeavor right now. Don't get used to anything. We'll remain in the no-man's land at least until the indices manage to move back above their 50-day moving average lines, both of which are plotted in purple on the charts above.
Even so, unless stocks manage to fall back under the 20-day moving average lines (blue) they crossed above two weeks back, the tailwind is technically bullish.