
 [1]It wasn't exactly a stellar end to the week; the S&P 500 lost 0.65% of its value on Friday after bumping into an unsurprising ceiling. But, in light of the big advance dished out over the course of the prior three trading days, investors were forgiving. The S&P 500 was up 2.4% last week, after falling nearly 13% from high to low… a low hit on Monday.
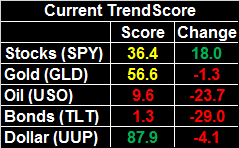
Was the setback and subsequent bounce a marker of a bigger pivot back into an uptrend? Probably. There are certainly a couple of key pieces of evidence that point in that direction. But, there's one last hurdle that needs to be cleared before the "all clear" is fully given.
We'll look at the key details below, but first, let's run down last week's economic news and preview this week's reports. There's a lot to think about.
Economic Data
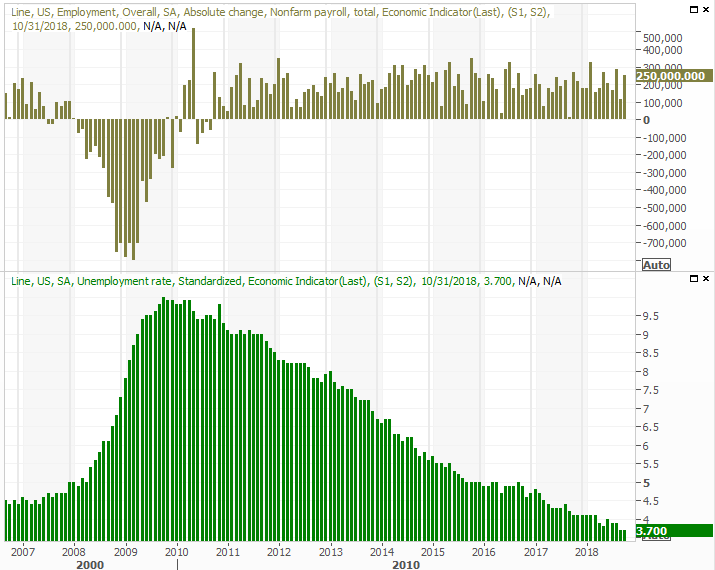
What a big end to the trading week! Though the market rally finally faded on Friday, investors were still able to cheer the bigger-picture bullishness suggested by a strong jobs market. For the month of October, the country added 250,000 net new payrolls, keeping the unemployment rate at a multi-decade low of 3.7%. Wage growth of 3.1% was the best year-over-year wage growth in nine years.
Job Growth and Unemployment Rate Charts
 [2]
[2]
Source: Thomson Reuters
In fact, the basic, headline numbers may understate just how firm the employment portion of the economic engine is right now. We explored the whole picture in detail at the website: https://www.bigtrends.com/stocks/october-jobs-report-is-another-big-win-for-the-economy/
Jobs weren't the only topic to come up last week, however. Well before that we heard the Case-Shiller Index, giving us a glimpse of how real estate prices are trending.
We already knew for a week ago that home values, though still on the rise, were picking up value at a much slower pace… as evidenced by the FHFA Home Price Index. The Case-Shiller 20-City Index confirmed this slowdown. The pros were calling for a 5.9% year-over-year improvement, but the actual pace of 5.5% was one of the weakest advances we've seen in a long, long while.
Home Price Index Charts
 [3]
[3]
Source: Thomson Reuters
Note that the updated data is only for August, but if anything, demand for homes has waned in the meantime as the cost of getting a loan has grown and the actual prices of homes have reached uncomfortable levels.
It's not a bull-market killer, but it certainly doesn't help. To that end…
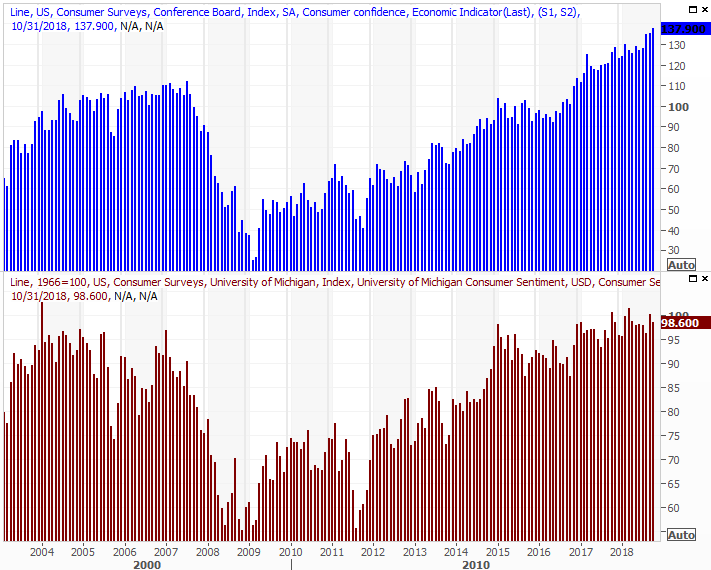
On Tuesday of last week we heard the Conference Board's measure of consumer confidence. It edged higher in October, reaching a multi-year high of 137.9. That strength hasn't been perfectly matched by the Michigan Sentiment Index, though both are still quite high. [They’re also measured differently, so the disparity isn’t a huge red flag.]
Consumer Sentiment Charts
 [4]
[4]
Source: Thomson Reuters
Consumers aren't likely to be afraid to buy a home. They're just making a financially-based decision not to. That's a significant detail.
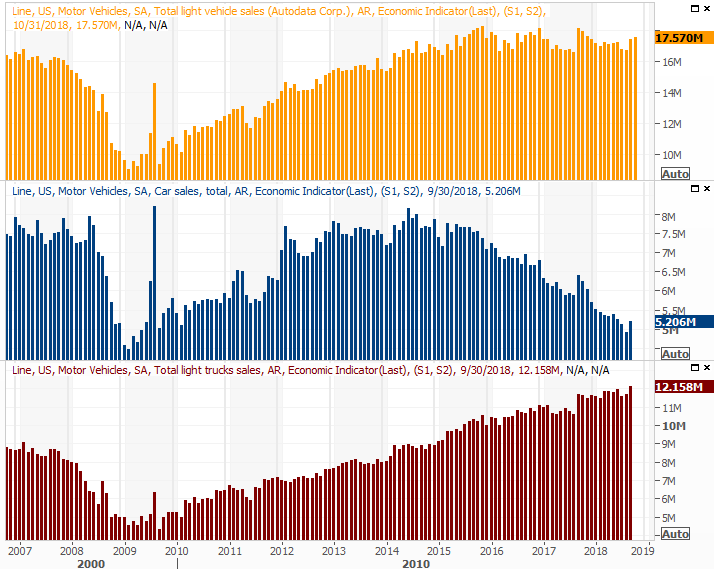
Finally, on Thursday we got a last month's automobile sales figures. It was a decent month, with sales of passenger cars up to a pace of 4.27 million and truck sales falling only from 9.39 million to 9.31 million. The overall pace was a bit better than September's. But, once again bear in mind that a couple of hurricanes may have prompted purchases as reimbursement checks started to arrive. In that light, the uptick in auto sales for the past couple of months isn't quite is robust as one might expect.
Auto Sales (Annualized) Charts
 [5]
[5]
Source: Thomson Reuters
Everything else is on the grid.
Economic Calendar
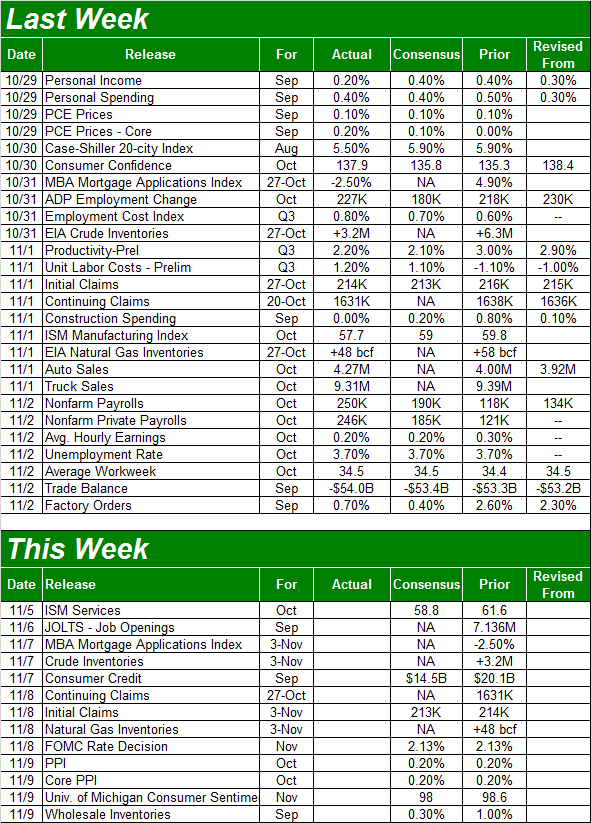 [6]
[6]
Source: Briefing.com
This week is relatively light in terms of quantity, but more than a few of the reports we'll be getting are heavy-hitters.
The party starts on Monday with a look at last month's ISM Services score, rounding out last week's ISM Manufacturing reading. The manufacturing measure fell, and economists are looking for a lull on the services side of things too. But, both are still well above the pivotal 50 level.
ISM Index Charts
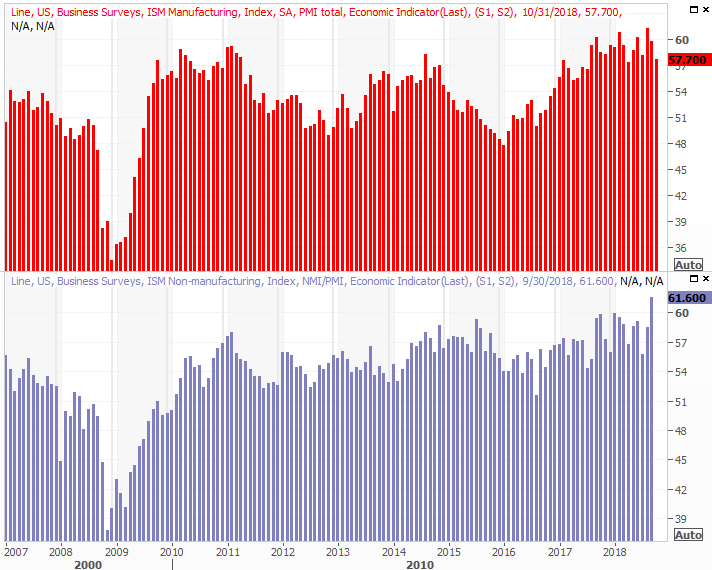 [7]
[7]
Source: Thomson Reuters
We'll hear about last month's producer inflation rate on Friday, though we won't get consumer inflation data until next week. Both are still inching higher though, and economists believe both were up in October at about the same pace they've been growing. Interestingly though, neither is racing higher. Inflation has been healthy, but largely tamed.
Producer, Consumer Inflation Charts
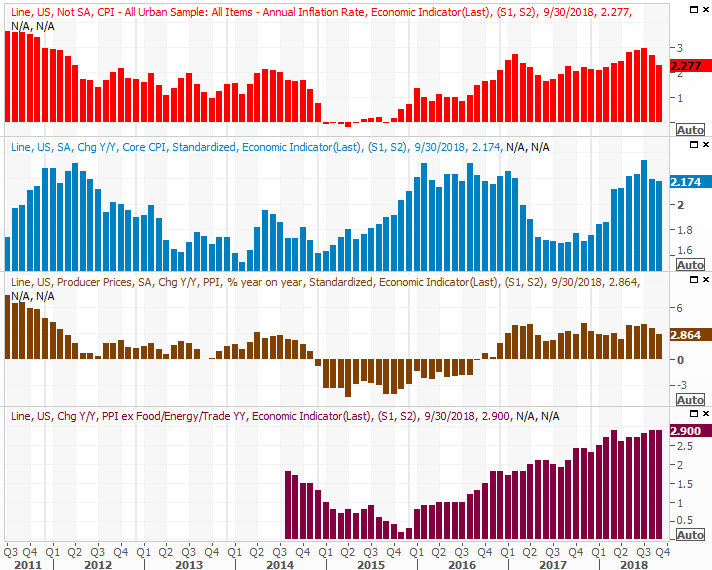 [8]
[8]
Source: Thomson Reuters
Though inflation may be tamed, it's certainly not been tamed enough to prevent the FOMC from raising interest rates by a quarter-point when it has the chance to do so on Thursday. Yet, as of the latest look, the pros are saying there's a 92.8% chance the target Fed Funds rate will be between 2.0% and 2.25% by the end of the week. It's the December window the pros think will be utilized to push rates upward within the Fed's bigger-picture paradigm.
Index Analysis
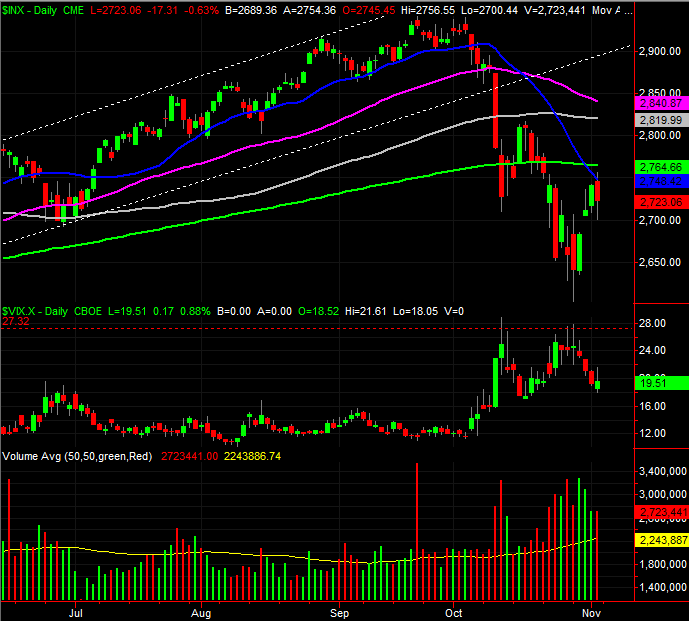
All in all, not bad. In some ways a bounce was inevitable, given the sheer scope of the meltdown over the course of October. And, it's not as if stocks collectively cleared the biggest hurdle they needed to in order to get the bullish ball rolling again. The effort thus far is solid though, and we're just one or two good days away from being back in a full-blown uptrend.
The make-or-break level (for the S&P 500 anyway) is the 20-day moving average line, plotted in blue. The index briefly pushed its way above that level on Friday, but was ultimately repelled by it. No big deal… recoveries are a process rather than an event. We can largely expect the initial test to be met with resistance. It's what happens from here that's so telling.
S&P 500 Daily Chart, with Volume
 [9]
[9]
Source: TradeStation
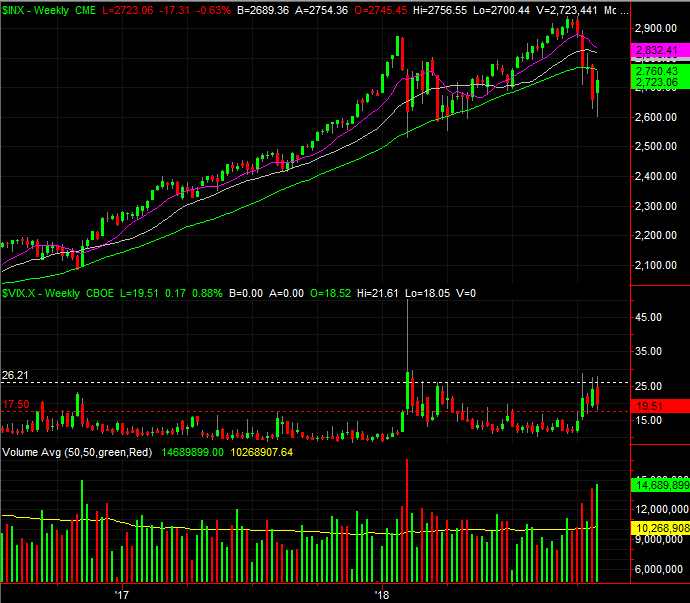
Also notice how the VIX is back in a downtrend, having bumped into an established technical ceiling around 27… a ceiling that was originally defined earlier this year.
Zooming out to a weekly chart we can put the recent pullback and last week's bounce in perspective. It is troubling that the S&P 500 has broken below the 200-day moving average line (green), which acted as support when it was tested earlier in the year. In fact, this is the first time we've seen the index below its 200-day line since 2016. It doesn't have to the game-changer it might normally be though. The 200-day moving average line was a relatively easy target because we'd gone so long without pulling under that long-term indicator.
S&P 500 Weekly Chart, with Volume
 [10]
[10]
Source: TradeStation
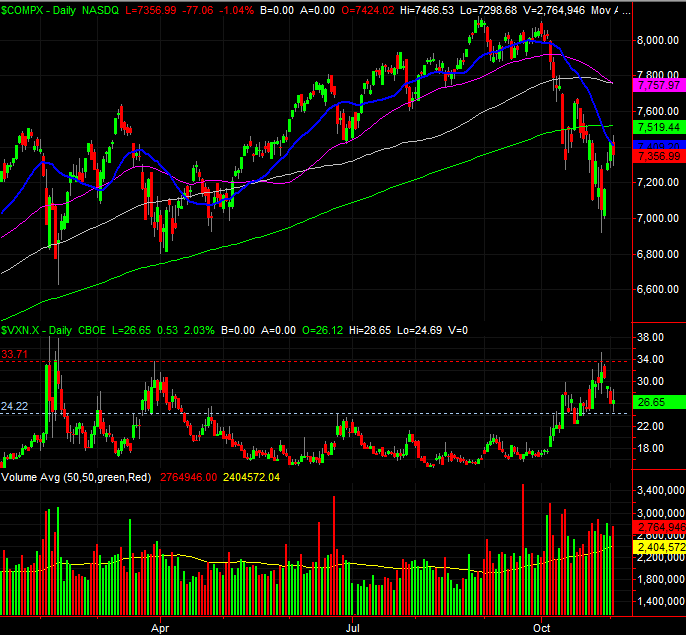
The daily chart of the NASDAQ Composite essentially tells the same story.
NASDAQ Composite Daily Chart, with Volume
 [11]
[11]
Source: TradeStation
Still, a possible rekindling of marketwide bullishness isn't the same as a confirmed recovery. Before we get the full green light, a couple of things need to happen. The first of them is a completed move above the 20-day moving average line. In fact, two consecutively higher closes would be a solid confirmation. Second, the VIX needs to fall back below 17.6. The VXN needs to fall below 24.3.
The thing to bear in mind is, none of those things might happen straight-away. As was noted, turnarounds are a process and can take two or three tries to complete. Don't assume a setback this week means the market is destined for lower lows. Earnings are still on the mend and the economy is still growing. The undertow needed for net-bullishness is still palpable.