
Another week, another whiff. Stocks ended up logging a second consecutive loss last week, and while a small one, it's the fifth straight week the market's been within striking distance of a bullish breakout but couldn't get the job done. Traders are getting frustrated, and nervous. The longer stocks wait to start their next bullish leg, the more possible it is for the would-be bulls to lose their nerve.
And yet, it's way too soon to lose hope… particularly after last week's big economic news.
We'll look at the market's current technical condition in a moment below. First, let's dive into the aforementioned economic report that offers a glimmer of hope for rekindled economic growth.
Economic Data Analysis
No need to dance around it – last week's highlight was the Bureau of Labor Statistics' look at April's inflation rates. The annualized consumer inflation rate cooled to a two-year low rate of 4.9%, while producer inflation fell all the way to 2.3%. On a core (ex-energy and ex-food basis) those numbers are slightly higher at 5.5% and 3.4%, respectively. But, that's still broad relief.
Consumer, Producer Inflation Rate Charts
 [1]
[1]
Source: Bureau of Labor Statistics, TradeStation
In short, the Federal Reserve really might be able to stick to its plan of not imposing any more rate hikes in the foreseeable future. Expectations for a rate cut within the coming year are still a little bit questionable, however.
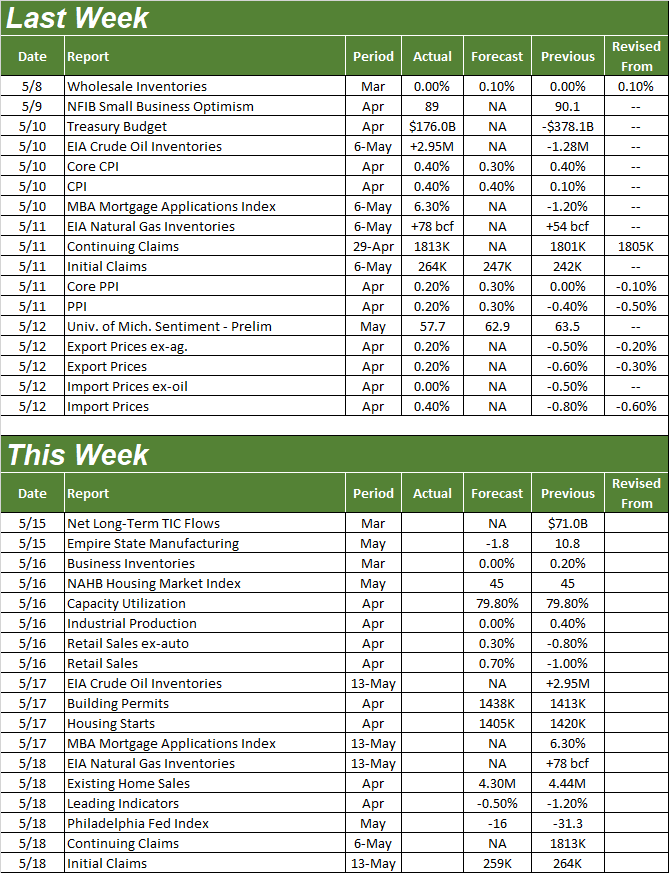
Everything else is on the grid.
Economic Calendar
 [2]
[2]
Source: Briefing.com
This week is a big one.
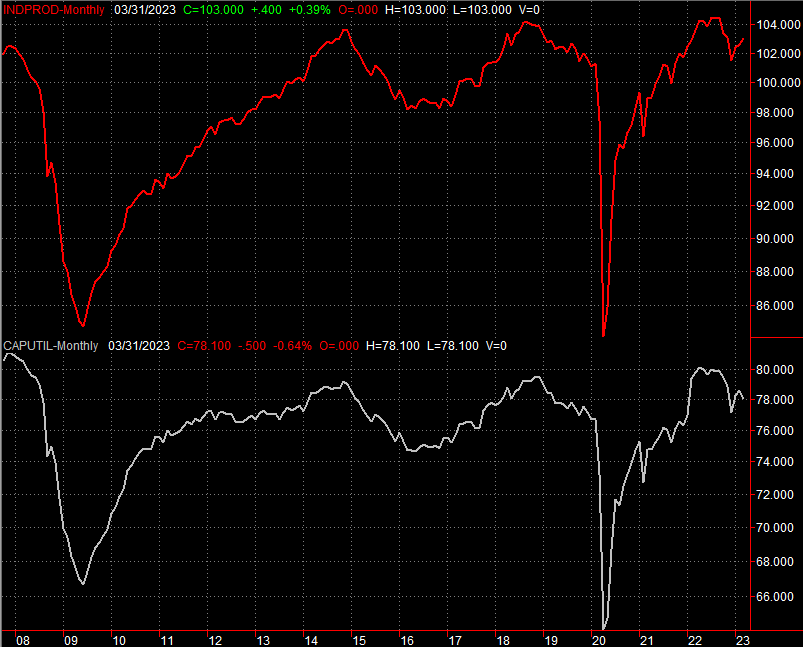
Things get going in earnest beginning on Tuesday, with the Federal Reserve's look at last month's capacity utilization and industrial productivity. Economists aren't looking for any change this time around. And, that's a problem. Neither indicator is especially impressive at its current level.
Capacity Utilization, Industrial Productivity Index Charts
 [3]
[3]
Source: Federal Reserve, TradeStation
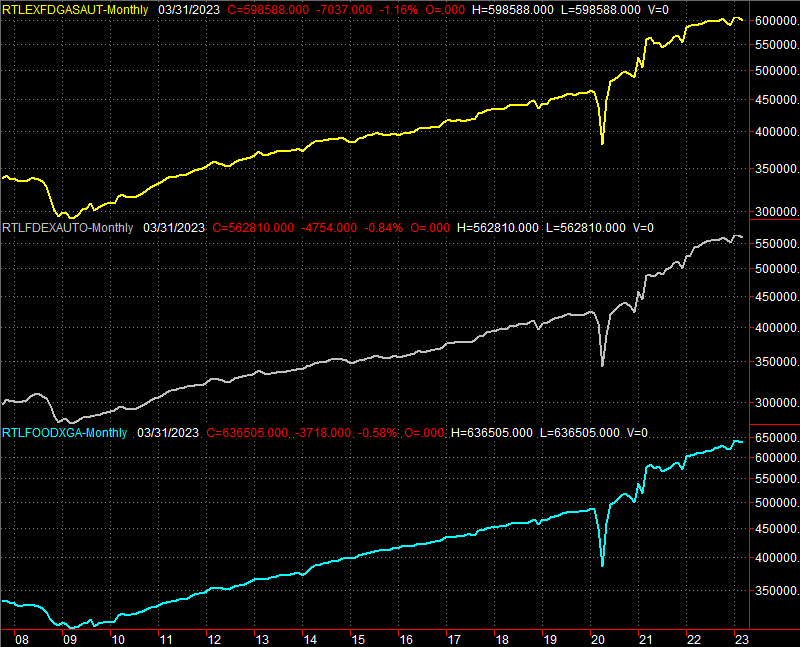
Also on Tuesday look for April's retail sales figures. Forecasters are calling for growth, but that bar is set low following March's dip. The stock market desperately needs a good showing for this consumerism is barometer.
Retail Sales Charts
 [4]
[4]
Source: Census Bureau, TradeStation
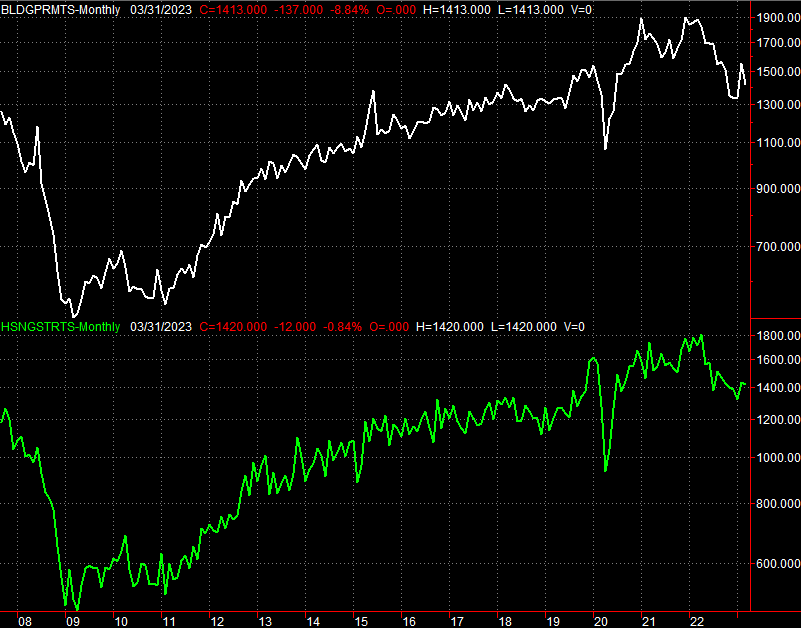
Look for last month's housing starts and building permits on Wednesday. Again, however, don't look for any real change. That's a problem too. Starts and permits are also at uncomfortably low levels. In fact, they're both still in bigger-picture downtrends.
Housing Starts and Building Permits Charts
 [5]
[5]
Source: Census Bureau, TradeStation
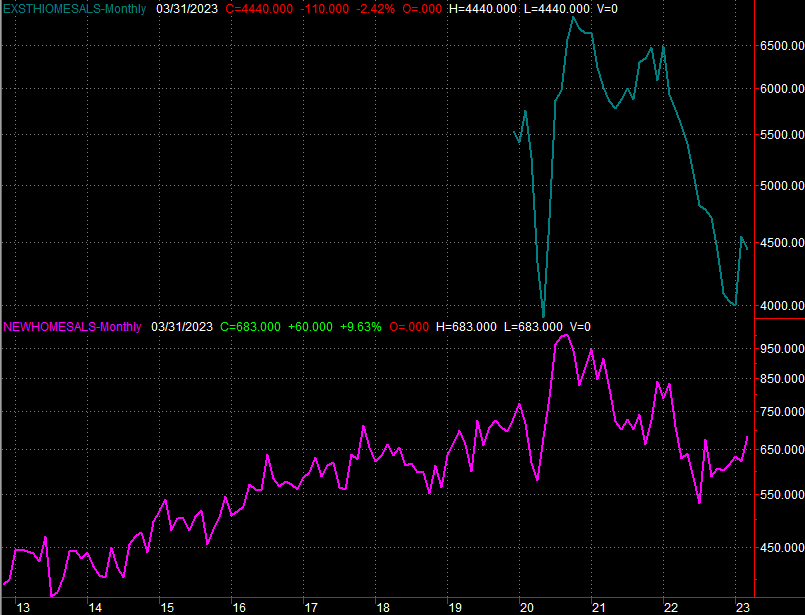
Starts and permits aren't the only real estate data on the radar this week either. On Thursday we'll hear about April's sales of existing homes. They'll likely be down too, extending the renewed pullback from March.
New, Existing Home Sales Charts
 [6]
[6]
Source: Census Bureau, TradeStation
The issue may be a sheer lack of existing homes for sale. Sales of new homes are much (relatively) stronger, and certainly recovering better. We'll get a better feel on this matter next week, when April's sales of new homes will be posted.
Stock Market Index Analysis
The market isn't doing badly. It's just not doing well, by virtue of not making any real forward progress since the middle of April. It remains in position to quickly get over that hump though.
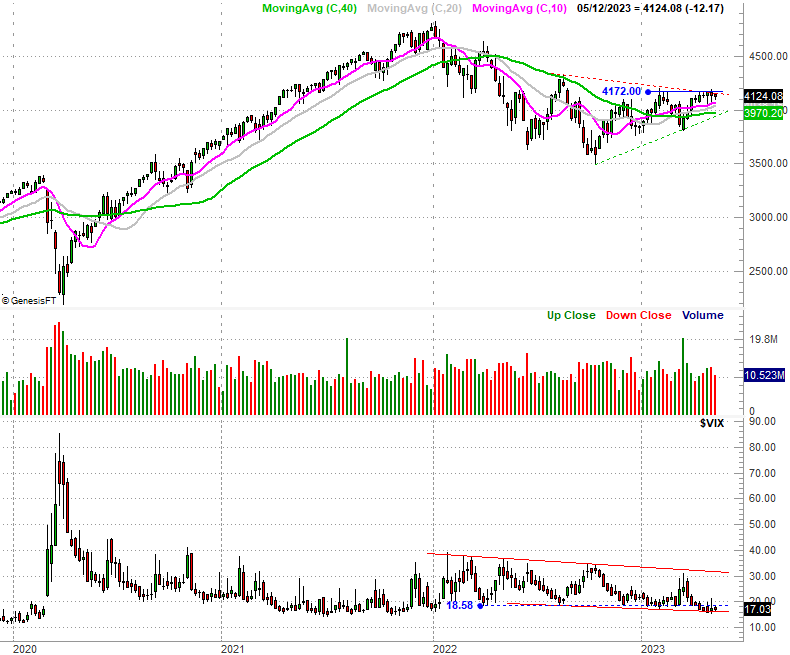
Nowhere is this more clearly evident than on the daily chart of the S&P 500. Take a look. The index seems to be finding support at its 20-day moving average line (blue) around 4124. But, it's also still finding resistance at the technical ceiling that connects all the major peaks since mid-August (red, dashed).
S&P 500 Daily Chart, with VIX and Volume
 [7]
[7]
Source: TradeNavigator
Zooming out to the weekly chart of the S&P 500 puts this ongoing test of the technical ceiling into perspective. There's resistance still in place, but the market's logging higher lows and nearly logging higher highs. All the key moving averages are also now sloped upward, suggesting the undertow is bullish in all key timeframes.
S&P 500 Weekly Chart, with VIX and Volume
 [8]
[8]
Source: TradeNavigator
The weekly chart shows us something else that's curious though… the volatility index (or VIX) looks like it's gone about as low as it's willing to go this time around. That doesn't necessarily bode bearishly for the market, but it does work against it.
The NASDAQ Composite is faring better. Namely, unlike the S&P 500, the composite has punched through its technical ceiling at 12,226. By doing so, it's shrugged off a great deal of impediment and can move higher without needing to prove anything else.
NASDAQ Composite Daily Chart, with VXN
 [9]
[9]
Source: TradeNavigator
As was the case with the S&P 500, zooming out to the weekly chart of the NASDAQ provides a much-bigger and much-needed perspective. The momentum is firmly bullish here, with nothing immediately ahead to trip the rally up. Still, the composite's volatility index (VXN) is also at an extreme low, with little to no room left to move lower. That's going to make things tough for the bulls to keep chugging higher.
NASDAQ Composite Weekly Chart, with VXN
 [10]
[10]
Source: TradeNavigator
While the momentum is technically bullish (and we tend to trade with the momentum until it's clear we can't), this is a case where it might be wisest to wait and see what happens from here.
Ironically, perhaps the best — the most bullish — thing that could happen to stocks here is a slight stumble to reset the bullish clock, burn off the froth, and let the volatility indexes push up and off of their current lows so the market can start a rally capable of lasting. It doesn't even need to a major setback. In fact, it likely wouldn't be. All of the indices have tons of technical support immediately below them at several different moving average lines… all of which have provided support in recent weeks.