
A week ago the market was toying with a correction. Now the bulls can’t be stopped. Fueled by fresh certainty on the politics front, the S&P 500 rallied a little more than 4.6%, reaching a record high in the process.
Will it last? Hard to say. One thing is for sure though. That is, the jump was a little too far, too fast, leaving the market ripe for a big pullback sooner than later. Indeed, the advance was already slowing down shortly after it started. Not that it means doom, but it’s a big ask from the bulls to expect more of the same from here. Never even mind the fact some technical resistance awaits just above.
We’ll take a detailed look at all of it below. First, however, let’s look at last week’s top economic reports and preview what’s coming this week. Of course, you already know the biggies.
Economic Data Analysis
While the outcome of the Presidential election is of course last week’s big news, let’s also not forget that the Federal Reserve — as was expected — served up another quarter-point rate cut on Thursday. Stocks responded bullishly, tacking on even more gains to the post-election rally.
And that still wasn’t all. On Tuesday we also heard the Institute of Supply Management’s services index update for October. It was good, rising instead of falling as predicted. In fact, the services index hit a two-year high, further cementing its recovery effort in place.
ISM Manufacturing, Services Index Charts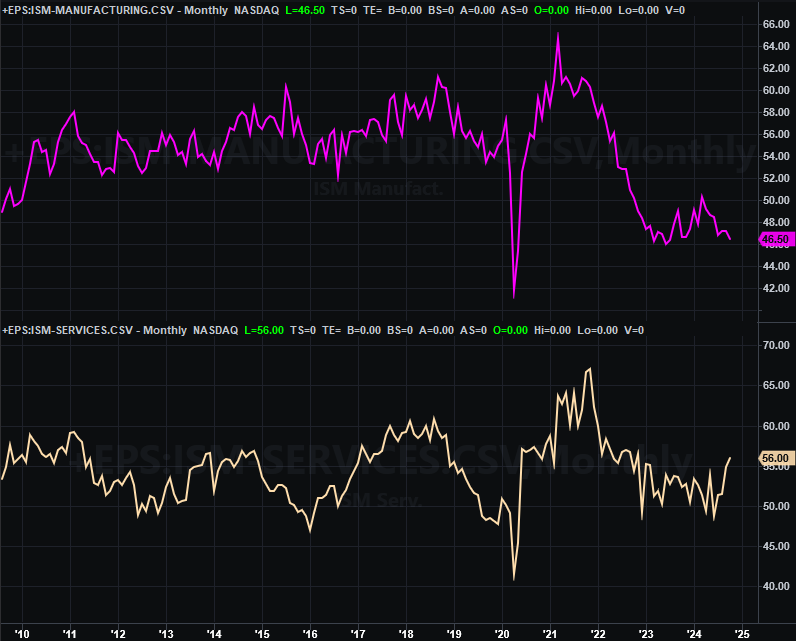
Source: Institute of Supply Management, TradeStation
Just notice that the ISM’s manufacturing productivity index continues to dwindle. (And, keep that data nugget in your back pocket for a moment.)
Everything else is on the grid.
Economic Calendar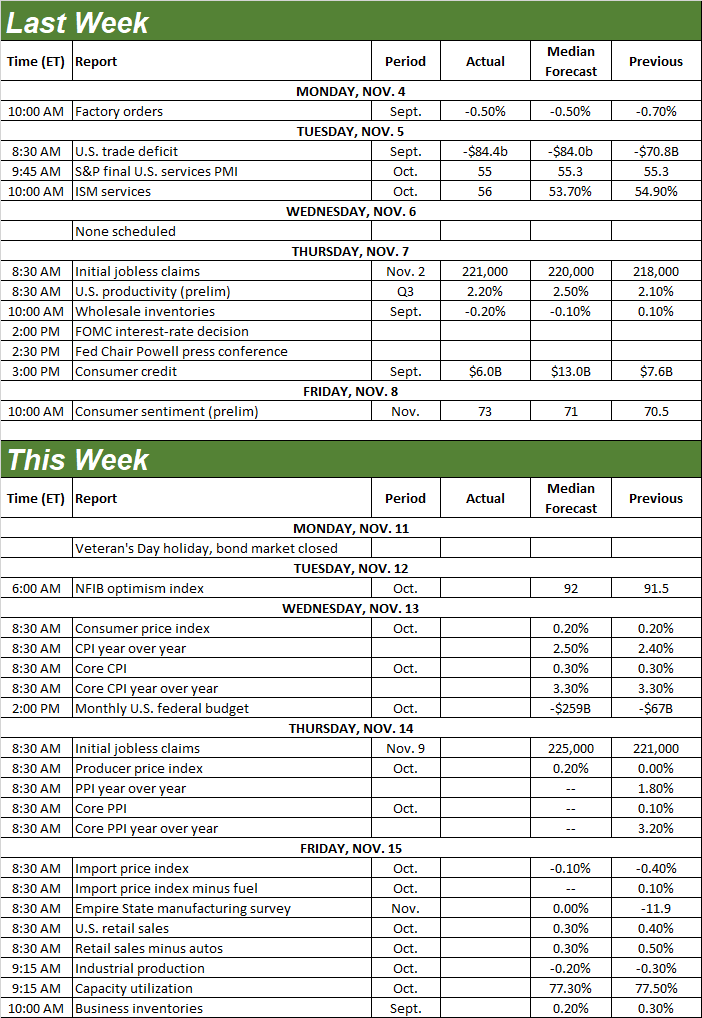
Source: Briefing.com
This week’s obviously going to be just as busy.
The party starts on Wednesday with last month’s consumer inflation numbers. It’s still a bit high, and likely to remain so; the Fed may not have had as much room to cut interest rates as believed. The producer inflation figures are coming on Thursday, although it’s the same basic story. While generally lower than consumer inflation, producer prices increases are also leveling off. They may even be inching higher here.
Consumer, Producer Inflation Rate (Annualized) Charts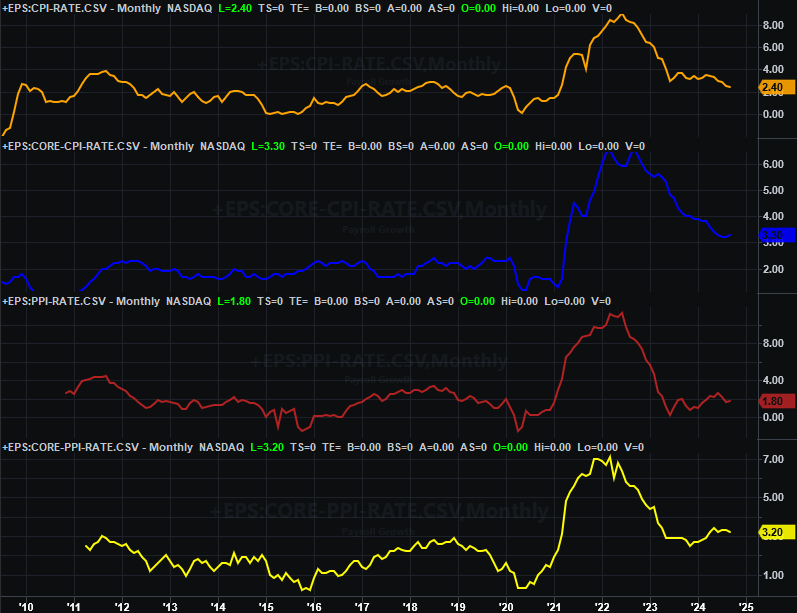
Source: Bureau of Labor Statistics, TradeStation
On Friday we’ll get last month’s retail sales numbers. As you can see on the chart below, after some stagnation they’re growing again. Economists are calling for comparable growth this time around.
Retail Sales Charts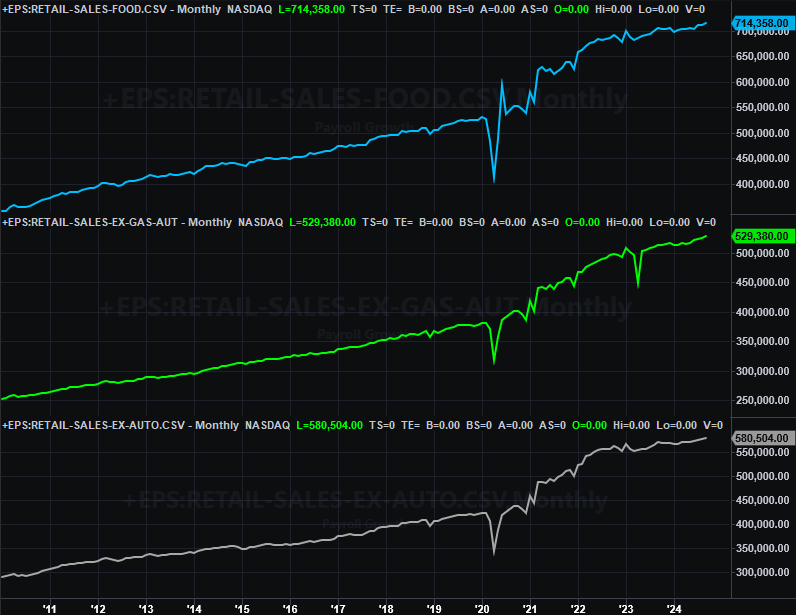
Source: Census Bureau, TradeStation
Finally, rounding out the bigger-picture look at the country’s industrial activity, the Federal Reserve’s capacity utilization and industrial production data for October will be posted on Friday as well. Both have been fading for some time now. Forecasters believe both inched a little lower again last month.
Capacity Utilization and Industrial Productivity Charts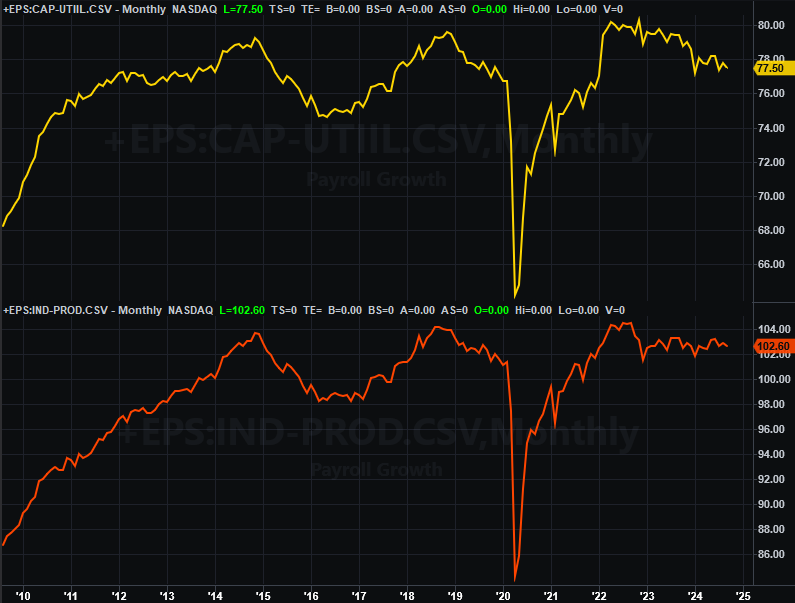
Source: Federal Reserve, TradeStation
Such a pullback of course jibes with the weakening ISM manufacturing index, which has also renewed its downtrend that got underway all the way back in 2021.
Stock Market Index Analysis
If you want proof that sometimes headlines can change everything for the market, just look at last week. A week earlier stocks were testing the waters of a correction. Last week — in response to the somewhat surprising election of Donald Trump — the market soared to new records. Clearly investors are bullish on what his presidency could mean.
But can the rally remain in motion? That’s the big question. From an odds-making and likelihood perspective, no, it can’t.
Take a look at the daily chart of the S&P 500 below. Pushing up and off of its 50-day moving average line (purple) at 5,728, the index jumped to a weekly gain of 4.6%. It’s already losing steam though. Although that can be blamed on a start that was much too strong (with a big gap left behind at Wednesday’s open), each day’s gains were progressively smaller. By Friday, the buyers were starting to back out of their positions… as evidenced by the way the S&P 500 ended up peeling back from its intraday high.
S&P 500 Daily Chart, with VIX and Volume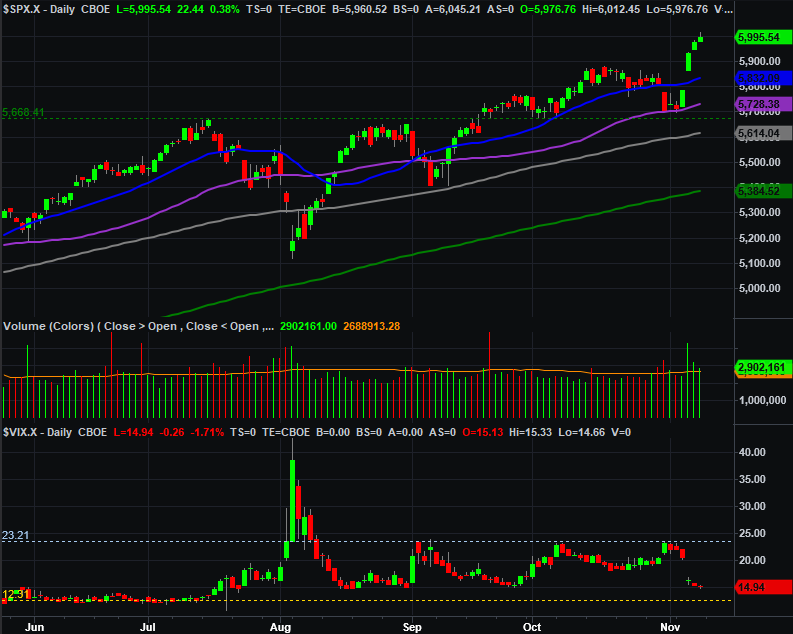
Source: TradeNavigator
The weekly chart sheds some light on why things are slowing down here. As you’ll see, the index bumped into one of two well-established technical ceilings (dashed, light blue) connecting several key highs going back to the middle of last year.
S&P 500 Weekly Chart, with VIX and MACD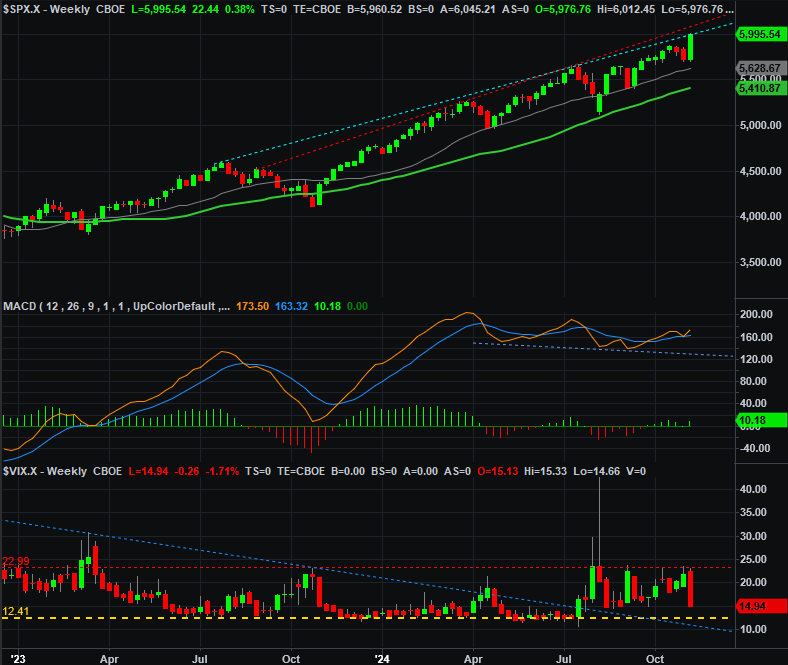
Source: TradeNavigator
That line is actually a very likely place for the bears to draw a line in the sand. Ultimately, this underscores the point that stocks are actually even more overbought than it seems on the surface. And they are. Since early August, the S&P 500 has advanced to the tune of 16.8%. That’s a lot with or without last week’s post-election jump. Just as they were a week earlier, would-be profit-takers may still be thinking about locking in some gains sooner than later.
The NASDAQ Composite’s chart looks similar, but not identical. As the weekly chart of the NASDAQ shows is, while this index also hit a record of its own last week, it’s not yet testing a long-standing technical ceiling.
NASDAQ Composite Weekly Chart, with VIX and MACD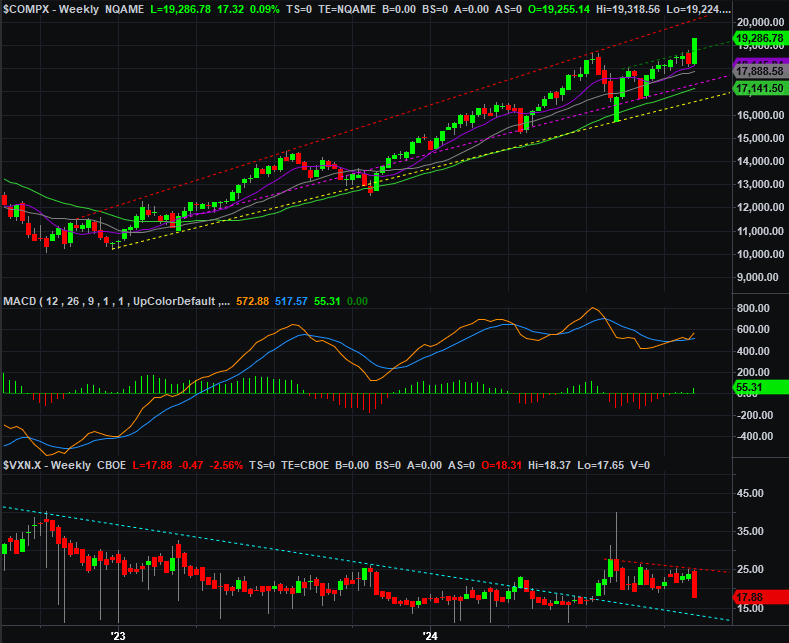
Source: TradeNavigator
Here’s the daily chart of the NASDAQ. As you can see from this vantage point, the composite did punch through a minor, near-term technical ceiling. As was the case with the S&P 500 though, the effort is already slowing down.
NASDAQ Composite Daily Chart, with VXN and Volume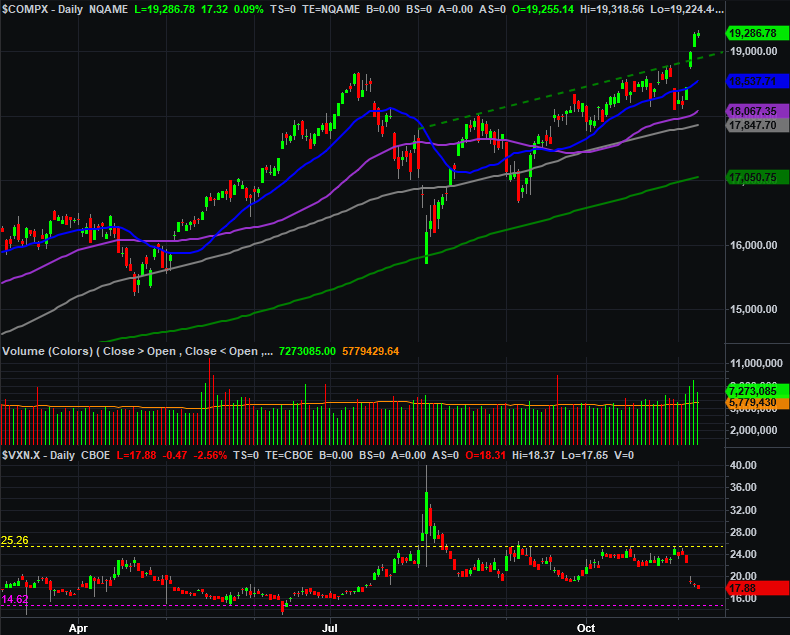
Source: TradeNavigator
So what now? There’s more downside risk than remaining upside potential. That doesn’t mean any pullback isn’t going to take shape immediately, however. The market could continue pushing higher, riding momentum put into place last week; the weakness seen later in the week could have been expected, and could easily be temporary.
Even if things cool off right at the beginning of this trading week, however, there’s still tons of technical support below…in the form of moving average lines. A small pullback, in fact, may be likely simply because things got so overextended last week.
Things are anything but bearish here — at least not yet.