Picking up where they left off a week earlier, the bears started last week in control. By mid-day Tuesday, stocks made a new multiweek low, and logged a new multiweek low close on Wednesday, testing the 50-day moving average lines for a second session in a row.
Then the bulls started pushing, driving the market to a second consecutive daily gain to end the week on a high note. Even so, stocks didn’t exactly back themselves out of trouble. They’re still under a key technical ceiling, and the intraweek bullish pushback was predictable, yet not necessarily meaningful.
Then there’s Friday’s nuance that’s simply suspicious.
We’ll talk about that in a moment. Let’s first look at last week’s economic reports and preview what’s coming this week. Given the news, it’s actually little surprising traders were ready, willing, and able to become buyers again to end the week.
Economic Data Analysis
In terms of official economic reports, there were really only two (related) sets of data dished out last week. That’s Wednesday’s look at last month’s consumer inflation, followed by Thursday’s producer inflation rate for May. As you almost certainly know, both were up from April’s levels, reaching three-year highs as a result. This is significant in that the Federal Reserve should almost certainly deal with it, but may also be hesitant to do so in fear of undermining an already-wobbly economy.
Consumer, Producer Inflation Charts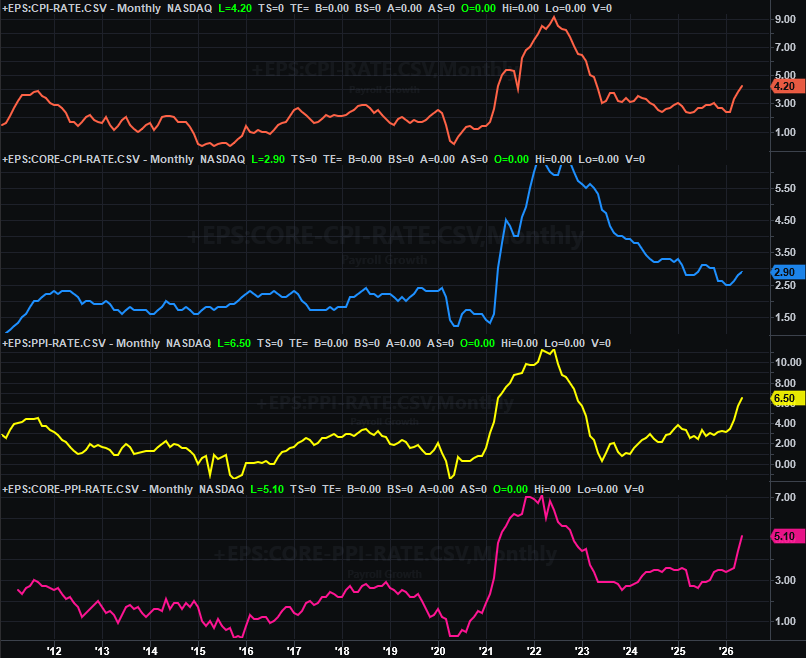
Source: Bureau of Labor Statistics, TradeStation
Given this information, it was surprising that traders were willing to make any decisive decision on Thursday or Friday.
That wasn’t the only economic information served up last week, however. On Tuesday, we heard last month’s report on sales of existing homes. They were up measurably more than the expected pace of 4.05 million, reaching 4.17 million units. That’s still unusually low though.
New, Existing Home Sales Charts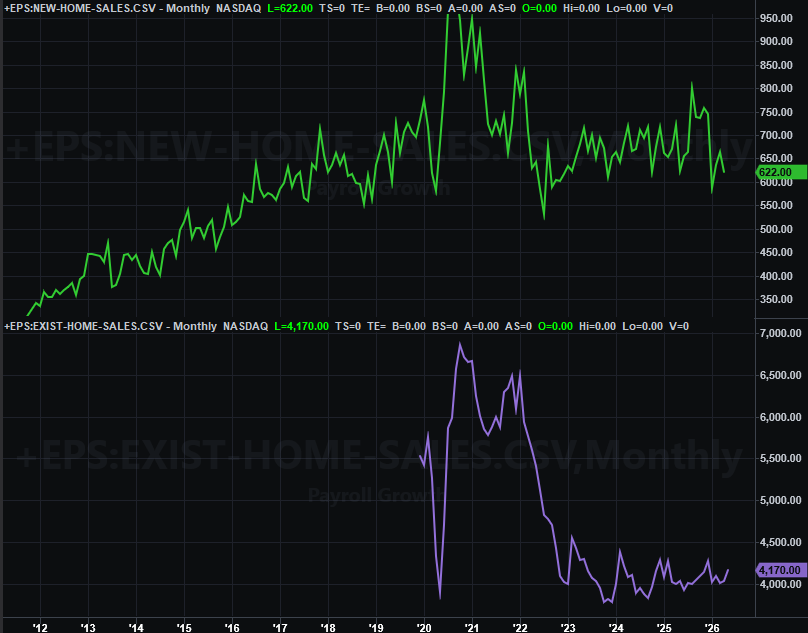
Source: National Association of Realtors, Census Bureau, TradeStation
May’s sales of new homes won’t be released by the Census Bureau until next week. Everything else is on the grid.
Economic Data Report Calendar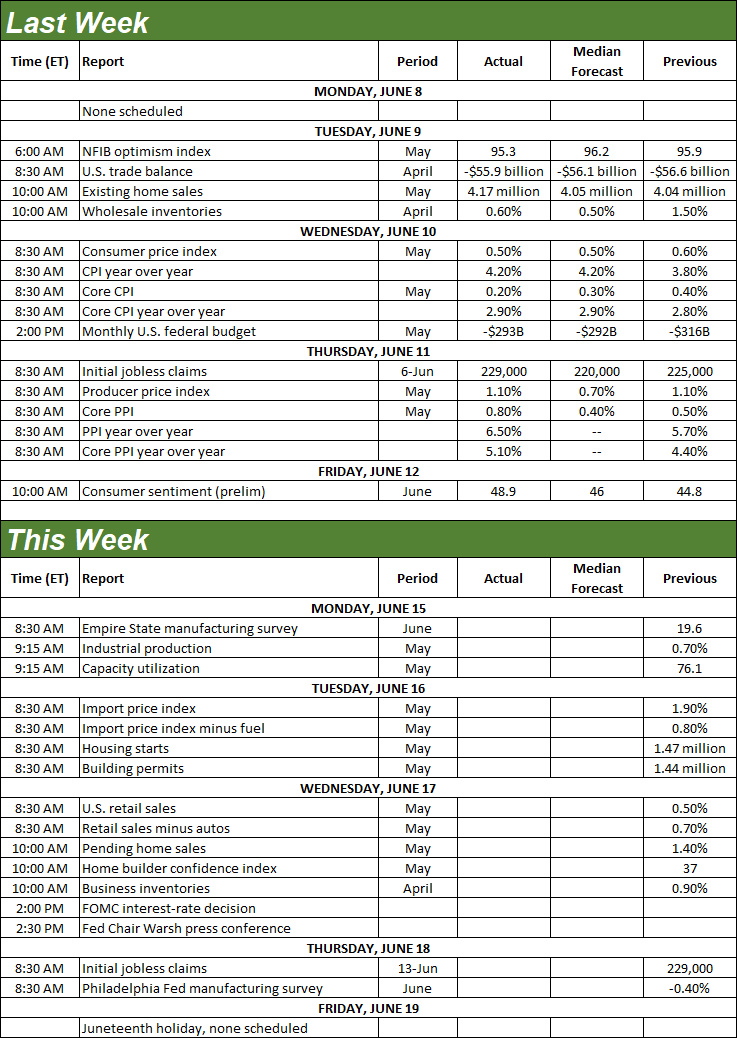
Source: Briefing.com, TradeStation
This week is pretty busy one in terms of economic news, condensed into four trading days due to the market’s closure on Friday on observation of Juneteenth. And that business starts on Monday with last month’s capacity utilization and industrial productivity from the Federal Reserve. Amazingly, both are inching higher, suggesting the domestic economy is holding up even when it seems like it shouldn’t be.
Capacity Utilization, Industrial Productivity Charts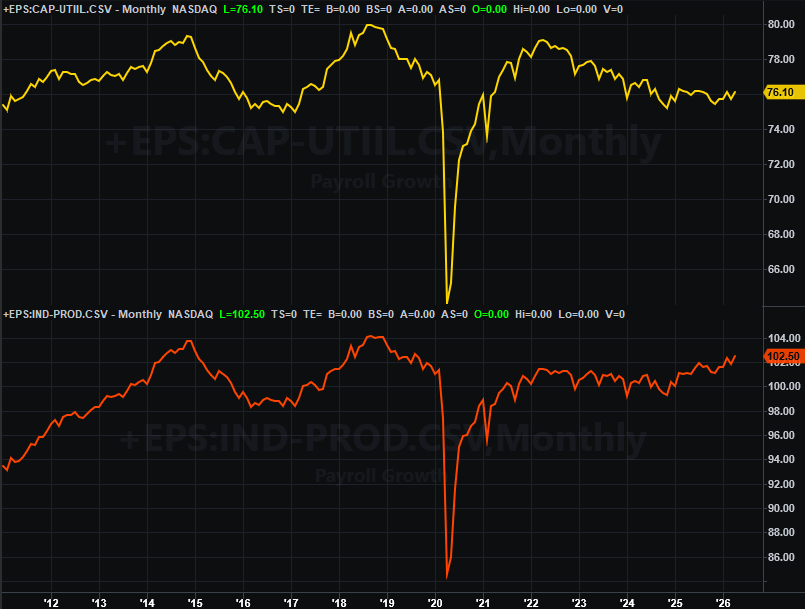
Source: Federal Reserve, TradeStation
May’s housings starts and building permits will be posted by the U.S. Census Bureau on Tuesday. This data has been and is apt to remain tepid, as well as indecisive.
Housing Starts, Building Permits Charts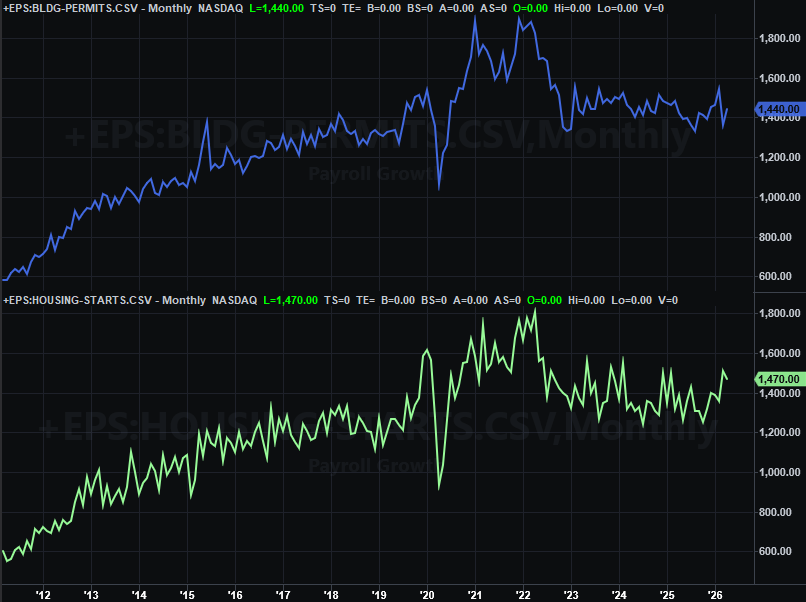
Source: Census Bureau, TradeStation
On Wednesday, look for last month’s retail sales from the Census Bureau as well. They’re likely to be up again, although only out of necessity… and inflation. People have to eat.
Retail Sales Charts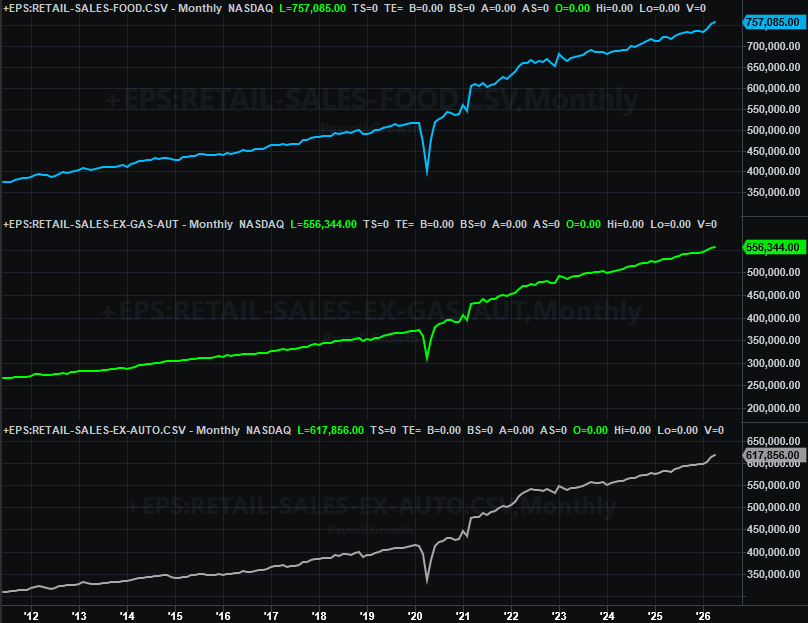
Source: Census Bureau, TradeStation
Of course, the information that investors will be most interested in on Wednesday is that day’s decision from the Federal Reserve regarding interest rates. Traders weren’t counting on any changes, and we’ll almost certainly not get any now. The language the Fed uses to explain its decision, however, is sure to be dissected simply because the matter became so much more important, and complicated.
Stock Market Index Analysis
Sure, the market rallied again on Friday, largely on news that an end to the conflict with Iran may be in the offing. Just bear in mind we’ve heard it before to no avail. Also keep in mind the market rallied when there was no end in sight to the conflict, so the if-then-causation relationship isn’t exactly reliable. It’s more arguable that stocks jumped Thursday and Friday — in spite of inflation readings that just won’t let the Federal Reserve cut interest rates anytime soon — just because they fell so hard over the course of the prior four trading days, and were ripe for a bounce. This rebound effort hasn’t proven anything yet. In fact…
The bounce effort was likely to materialize when, where, and how it did regardless of headlines. Take a look at the daily chart of the S&P 500 below. Specifically, notice how the index found and tested technical support at what had been a technical ceiling (red, dashed) for several months until last month. It’s not really surprising; it can and does happen. It’s also no surprise that it pretty much happened right around the 50-day moving average line (purple), which is a pretty common ceiling/floor.
S&P 500 Daily Chart, with Volume and VIX 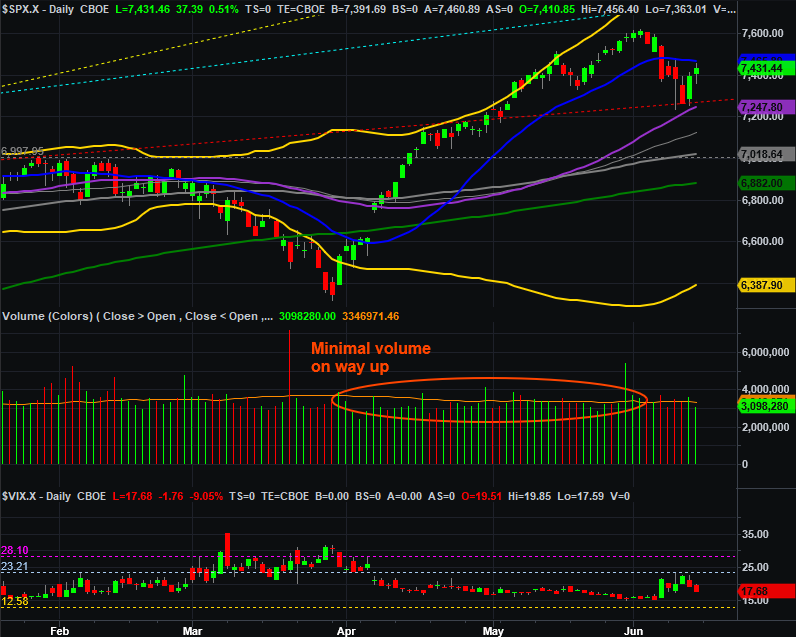
Source: TradeNavigator
More than anything though, notice what did NOT happen last week. The S&P 500 did NOT move back above its 20-day moving average line (blue). It only tested it as resistance… and did so with some precision; it’s almost as if traders were planning on letting the rally effort stall here. Also notice that there was very little volume on Friday behind the second day of the rebound effort (and there wasn’t a whole lot of volume on the first day of the turnaround either, for that matter).
The point is, everything we’ve seen so far can be chalked up as nothing other than the volatility you’d expect to see in the middle of a corrective move.
The daily chart of the NASDAQ Composite looks similar, although not exactly the same. The NASDAQ fully tested its 50-day moving average line (purple) as technical support on Tuesday and Thursday, and passed that test with flying colors. Even so, it didn’t even think about trying to test its 20-day line (blue) as a ceiling. And like the S&P 500, there wasn’t a whole lot of volume with Friday’s gain… something especially surprising given SpaceX’s IPO, and the rotation out of a bunch of other NASDAQ listings that it spurred.
NASDAQ Composite Daily Chart, with Volume and VXN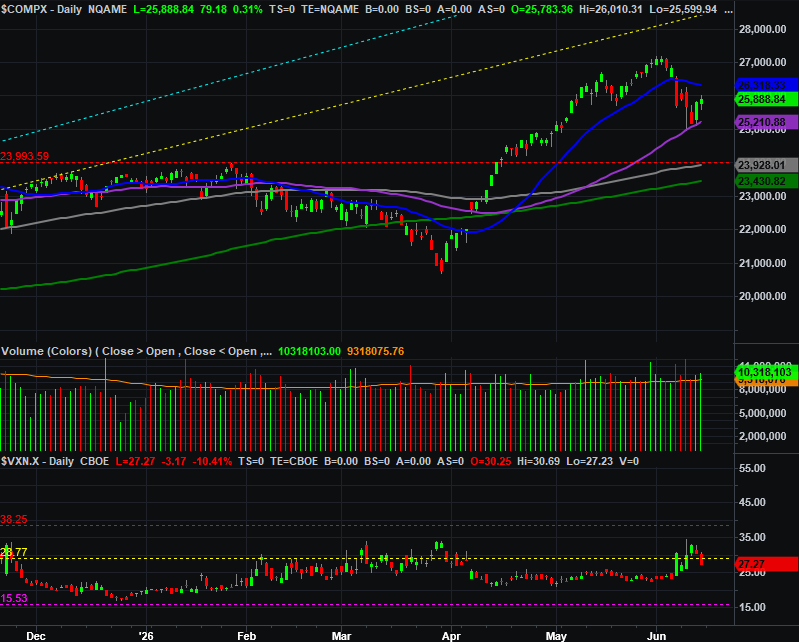
Source: TradeNavigator
The weekly chart of the S&P 500 (still) kind of makes sense of the past couple weeks’ worth of action. The runup from the latte-March low was testing a long-established resistance line. And, when forced to commit, the bulls bailed out. It’s not too late for them to step back up to the plate and reignite the rally from here. However, in many regards the market might be better served by going ahead and finishing the correction it started. That wouldn’t have too mean anything more than a trip back to the 6,950-ish area, which would be about a 9% correction… enough.
S&P 500 Weekly Chart, with MACD and VIX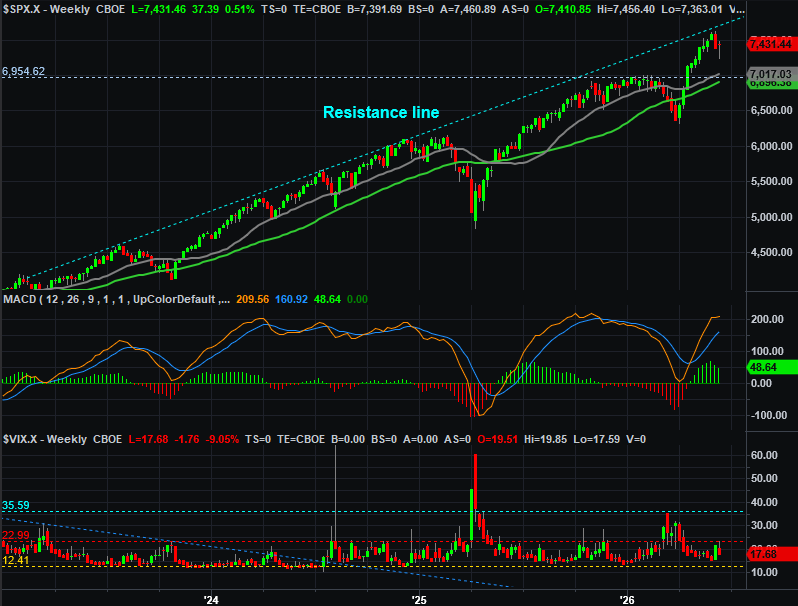
Source: TradeNavigator
The weekly chart shows us something else that might be coming into play now as well. That’s the possibility that the S&P 500’s Volatility Index, or VIX, at the bottom of the chart might be bumping into established technical resistance (red, dashed) at 23.4. If that’s the case, it will help bring a quick — maybe immediate — end to the market’s recent weakness.
We still contend there’s likely to be more downside left to suffer. And, ironically, while and end to the conflict will obviously be good news in the long run, it may well spark a contrarian “sell the news” selloff. A post-IPO slump from wildly-overvalued SpaceX stock could also help contribute to a continued corrective effort just by setting a broad bearish tone that weighs down most of the other tech stocks that are leading the bullish charge. Again, we’ll talk downside targets if-and-when it matters. A break under the 50-day moving averages that sticks will make it matter.
For now, the smartest move may be doing nothing and letting everyone else show their hands first.