
Not a lot of news dropped last week, but what we did get was important… particularly for the real estate sector. Sales of existing homes fell to a multi-year low pace of 3.84 million, and sales of new-homes ticked up to a pace of 738,000. While that’s an improvement, it’s an improvement from a relatively weak number. It’s also an improvement largely because so few existing homes are selling.
New, Existing Home Sales Charts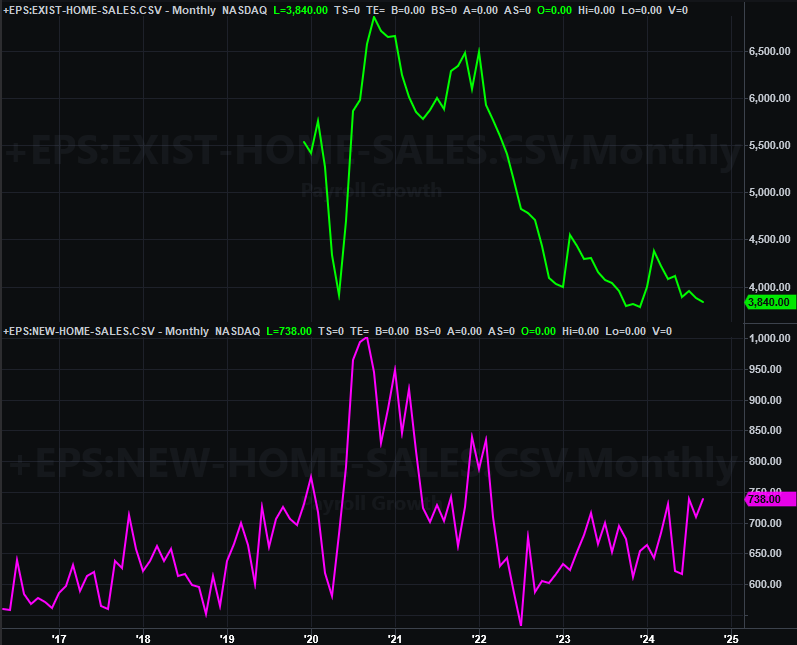
Source: U.S. Census Bureau, National Assn. of Realtors, TradeStation
We’re also got the University of Michigan’s third and final sentiment reading for October on Friday. At 70.5 it was only a little better than September’s score, but there is clear overall improvement here. The problem is, the Conference Board’s consumer confidence trend looks like it’s trying to worsen rather than improve.
Consumer Sentiment Charts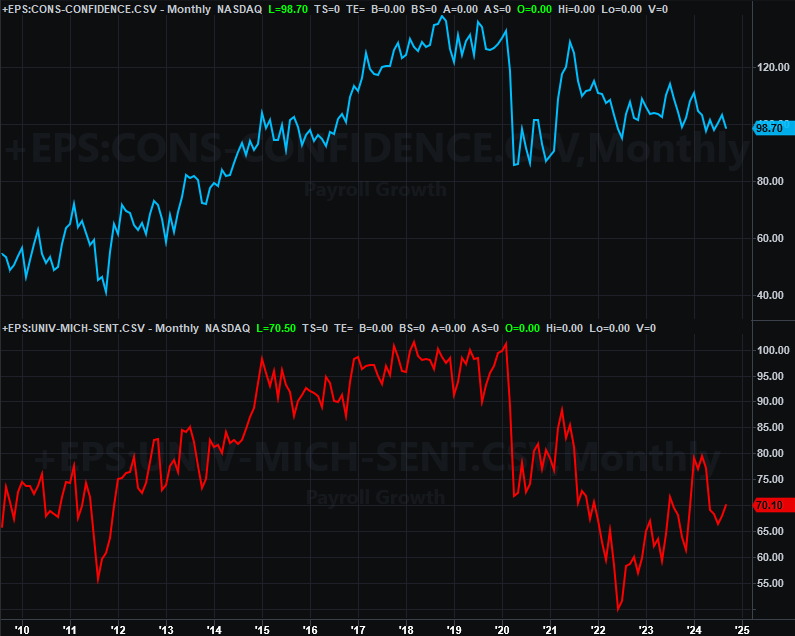
Source: University of Michigan, Conference Board, TradeStation
The Conference Board’s consumer confidence report for October is due on Tuesday of this week, by the way. Everything else is on the grid.
Economic Calendar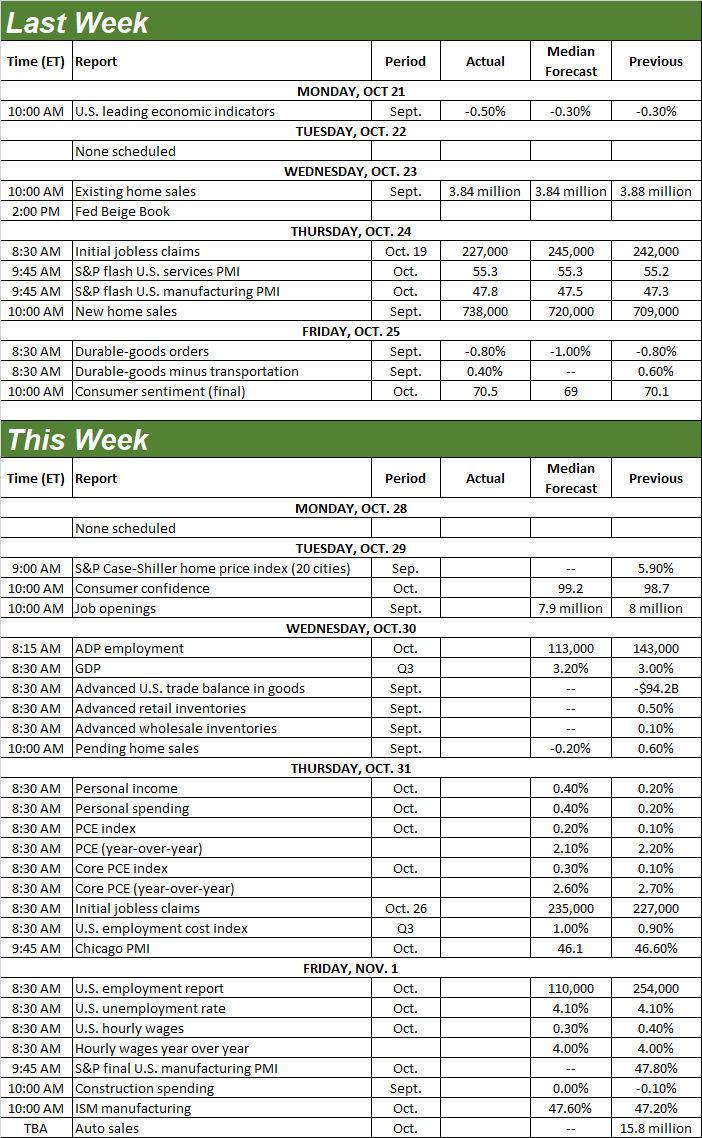
Source: Briefing.com
This week’s a whopper.
In addition to this month’s consumer confidence score, also on Tuesday we’ll hear the Case-Shiller Index update as well as the FHFA Home Price Index. Although both are for September, they’ll still be worth watching. Just bear in mind they’re only part of the real estate picture. Although home prices are likely to continue inching higher, just remember that fewer homes are transacting now.
Case-Shiller, FHFA Home Price Charts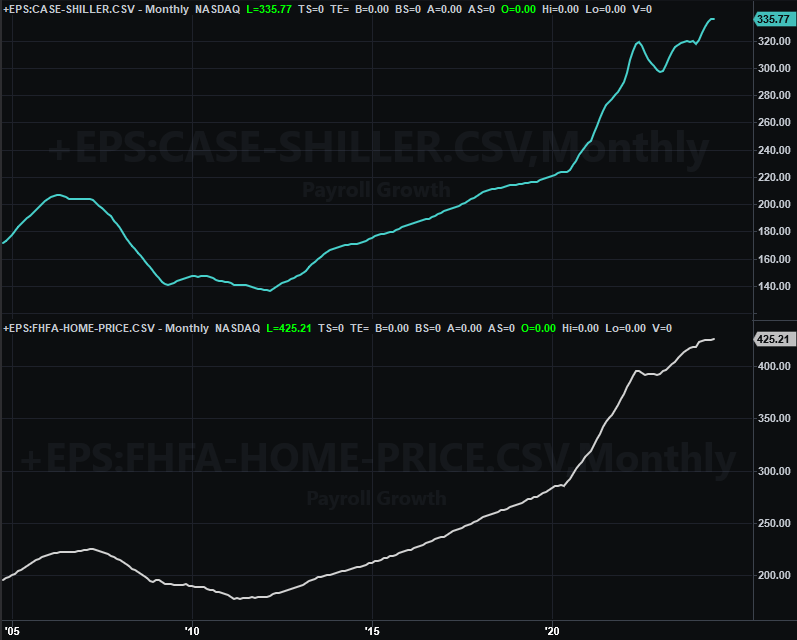
Source: Standard & Poor’s, FHFA, TradeStation
Although we’re not charting here, know that on Thursday we’ll get October’s consumer spending and income numbers. These are the data points the Federal Reserve looks at first when making interest rate decisions, and forecasters are calling for an acceleration of September’s growth of both measures. This is going to make it tougher for the Fed to lower rates. Indeed, there’s an argument to be made for higher interest rates.
In this same vein, on Friday look for October’s jobs report. Things had been worsening on this front, until September when we saw enough solid job growth to pull the unemployment rate down from 4.3% to 4.1%. Economists believe that was more of a one-off improvement. Things are expected to cool off again this time around, rekindling the bigger-picture deterioration.
Unemployment Rate, Payroll Growth Charts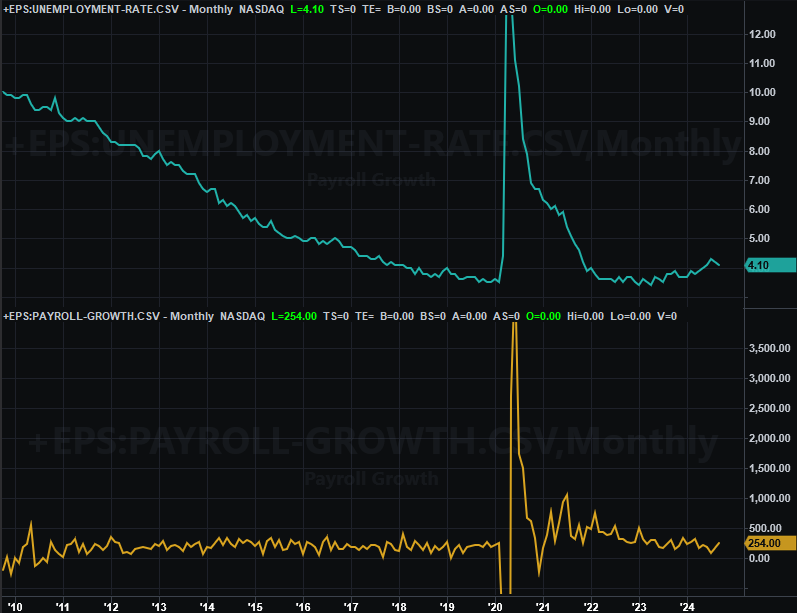
Source: Bureau of Labor Statistics, TradeStation
Stock Market Index Analysis
The bulls did their best, but when all was said and done, it just wasn’t enough. The S&P 500 lost nearly 1% of its value last week, and though the NASDAQ Composite mustered a slight gain for the five-day stretch, its failure to hold onto most of Friday’s intraday gains is still a worry. That’s especially the case given where the composite peaked before it pulled back.
Let’s start there… with a look at the daily chart of the NASDAQ. As you can plainly see, all it took was a kiss of the technical resistance line (green, dashed) that connects all the key highs since early August to push the buyers back out of the market. The composite closed near its low for the day, setting up a weak start to this week.
NASDAQ Composite Daily Chart, with VXN and Volume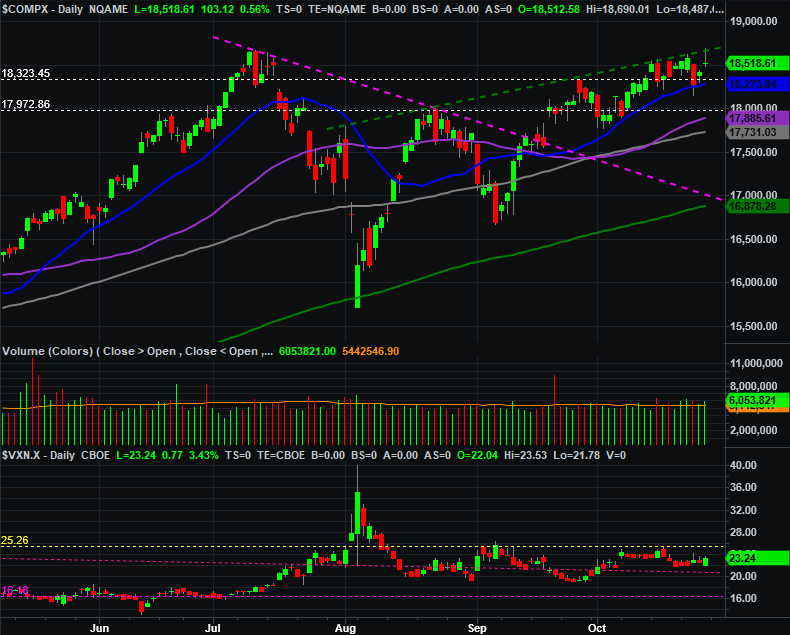
Source: TradeNavigator
The daily chart of the S&P 500 looks even worse… although also better (at least in some ways). Although it was never going to test a new high on Friday, the 20-day moving average line (blue) at 5,789 was verified as a technical floor each of the last three days of last week. The bulls seem to have drawn a line in the sand there.
S&P 500 Daily Chart, with VIX and Volume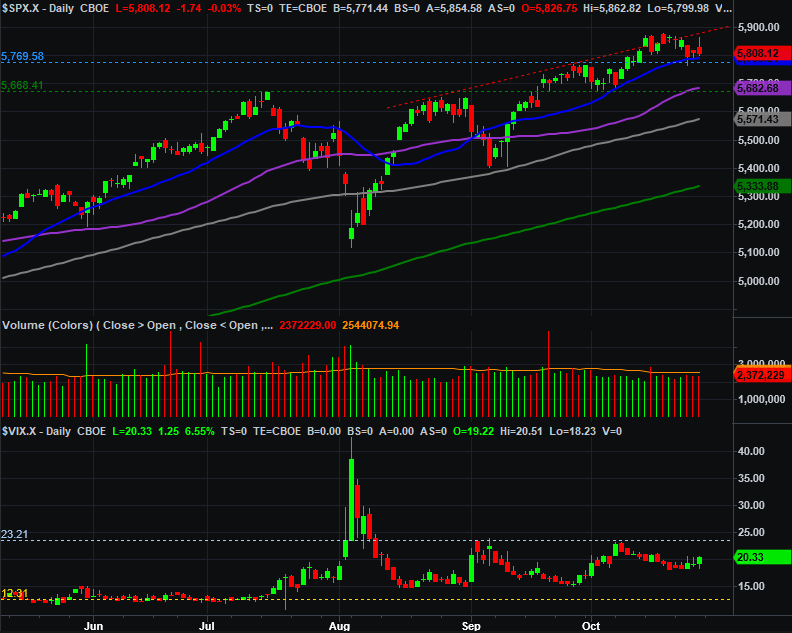
Source: TradeNavigator
Now take a step back and look at the weekly chart of the NASDAQ Composite, for a little more perspective on the “bigger picture.” From this vantage point it’s clear that the bigger trend is bullish. Moreover, there’s room to continue rising before hitting any major technical resistance. See the dashed red line? That’s actually the upper boundary of the current bullish channel. It’s about 1,200 points about the composite’s current value.
NASDAQ Composite Weekly Chart, with VIX and MACD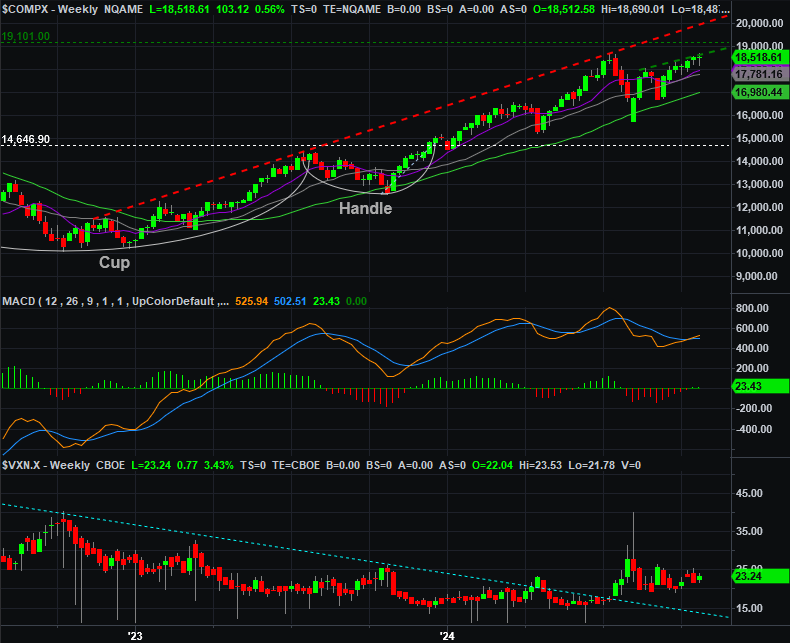
Source: TradeNavigator
So… bullish, right? Not so fast.
Although the tone and timbre of the market’s current condition may look and feel (mostly) bullish on the surface, traders are quietly filing out of the market. It’s just difficult to see… unless you know how and where to look.
On that note, the image below is one we look at on occasion, but only when merited. It’s a comparison of the NYSE’s up and down daily volume, as well as the exchanges’ advancers and decliners. The daily data is too erratic to use, so we plot moving averages of these numbers to discern a trend. And, as the chart shows, the advancer trend has actually been weakening since late September, while the decliner trend has been picking up steam since early this month. Meanwhile, up volume really started to fall a couple weeks ago, and though down volume’s down overall as well, it’s certainly not falling anymore.
S&P 500 Daily Chart, with NYSE Advancer/Decliner and Up/Down Volume Trend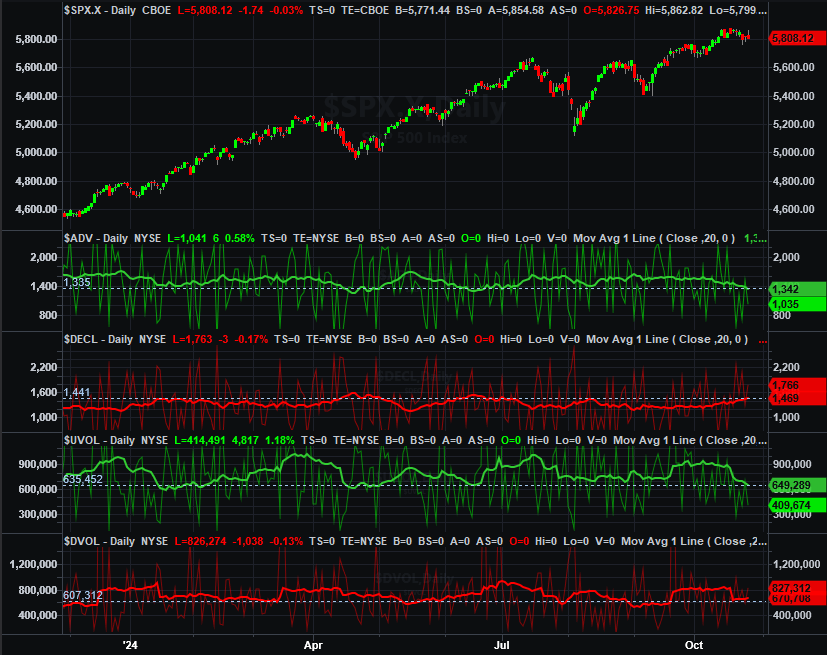
Source: TradeNavigator
So what is this telling us? It’s only one part of a much bigger report card. However, this comparison of the NYSE’s breadth and depth (and the NASDAQ’s is starting to look about the same, by the way) says that while the market’s momentum looks bullish on the surface, the tank’s running out of gas; the bulls are running on fumes. Bullish interest is actually quite anemic. Traders are taking opportunities to quietly lock in profits and head to the sidelines.
That may ultimately be a mistake. It certainly was in April. There’s also no denying the indexes continue to find technical support, with plenty more below to bring an end to any selling that might still develop from here. Never even mind the fact that we’re now in what’s normally a bullish time of year.
Nevertheless, we can’t rule out the prospect of a pullback turning into a more serious full-blown correction. We’re certainly due. We just don’t want to move too predictively, anticipating such an event. It’s going to take a LOT of technical damage from here to start any real selling. There’s just too much technical support below.