
Once again the bulls were playing with fire, and once again the bulls avoided getting burned. Despite evidence to suggest (or confirm) the Federal Reserve will be in no hurry to lower interest rates, traders chose to see the glass as half-full rather than half-empty, pushing the market back to within sight of its recently-reached record highs.
It’s still a bit too soon to say higher highs are a foregone conclusion. There’s just something that doesn’t feel right about this bullish effort. The trend is the trend though, and in more than one way the market’s setting up a squeeze that could end up shoving stocks to those seemingly-unlikely highs.
Or the same squeezing could work against the market too.
We’ll weight it all in a moment below. Let’s first look at last week’s economic news, including the numbers that pushed stocks higher.
Economic Data Analysis
Last week’s biggest news was of course January’s inflation reports. On Wednesday we learned last month’s consumer prices edged a little higher again (with or without food and energy costs). Then on Thursday, we learned the nation’s factories and production facilities are feeling the same price hikes. None of them are egregious, but all of them pour a bit of salt in wounds that may still feel open.
Consumer, Producer Inflation Rate Charts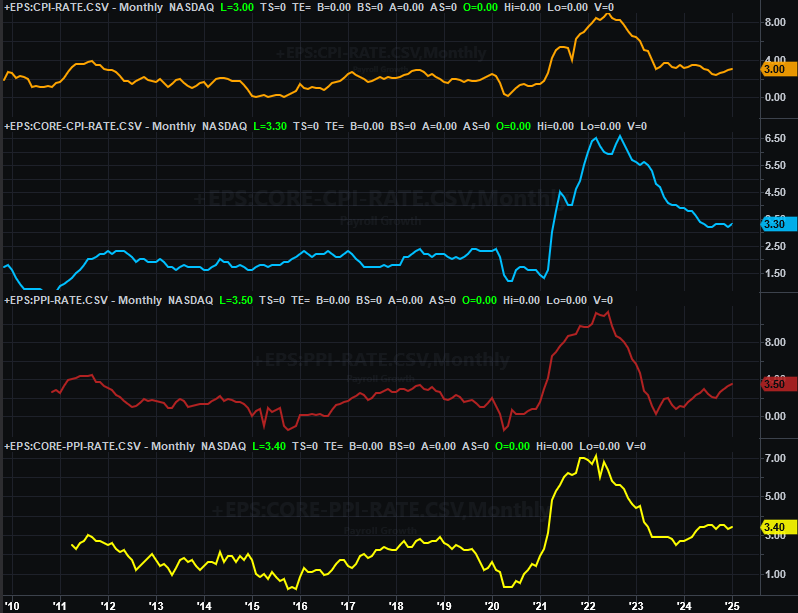
Source: Census Bureau, TradeStation
This of course throws a wrench in the Federal Reserve’s tentative plans to lower rates a few times over the course of the coming couple of years. It can still do so. But, the Fed will certainly need to exercise caution in how it proceeds from here.
That being said, the FOMC may have a bit more room to maneuver in this front than the inflation numbers alone might suggest. Unexpectedly, last month’s retail sales contracted rather than grew, suggesting consumers are tightening their purse strings rather than loosening them up.
Retail Sales Charts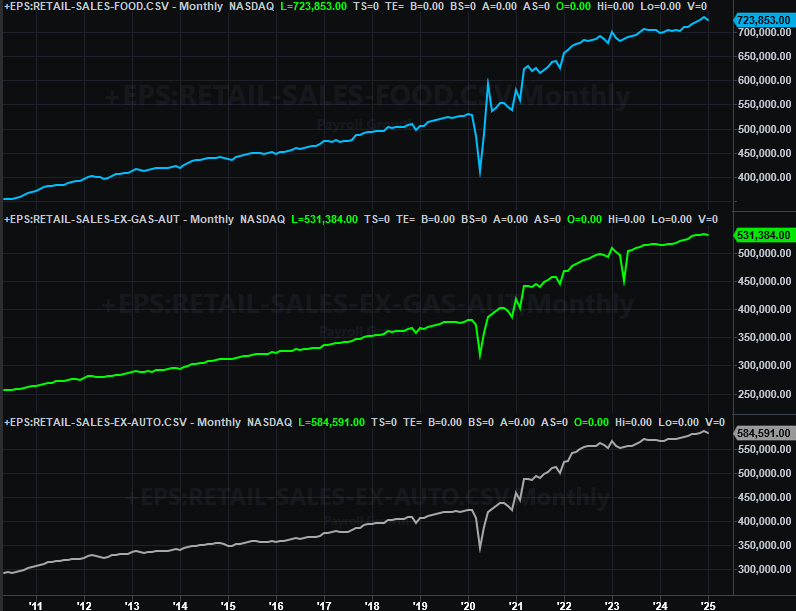
Source: Census Bureau, TradeStation
It’s possible — even probable — that inclement weather was the key reason behind this slowdown. Even so, the slowdown is being felt by retailers, who make procurement and employment decisions based on sales. One rough month isn’t a huge red flag. If this becomes two or more months of contraction though, it’s cause for greater concern.
Finally, on Friday we heard about the nation’s industrial productivity and usage of its factory capacity. Both improved a little, and by more than projected. This partially offsets the worries raised by other economic news released earlier in the week.
Capacity Utilization, Industrial Productivity Charts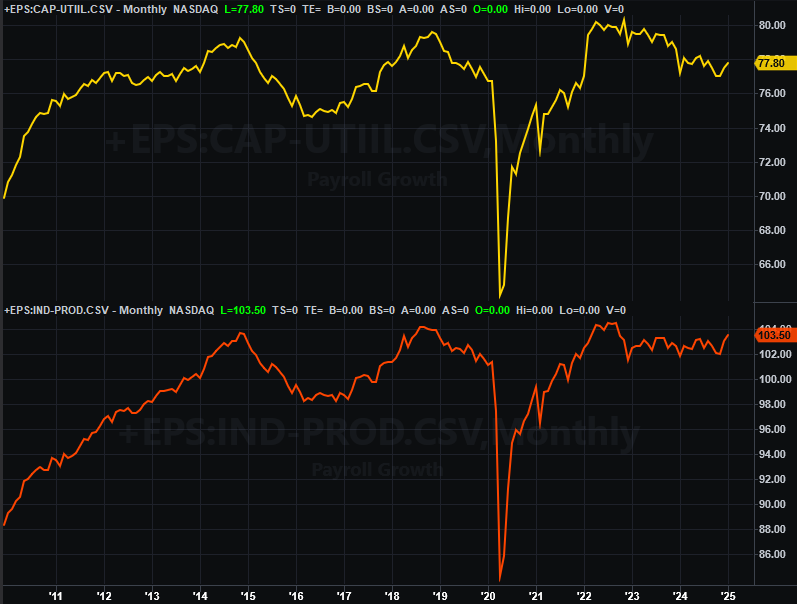
Source: Federal Reserve, TradeStation
Everything else is on the grid.
Economic Data Report Calendar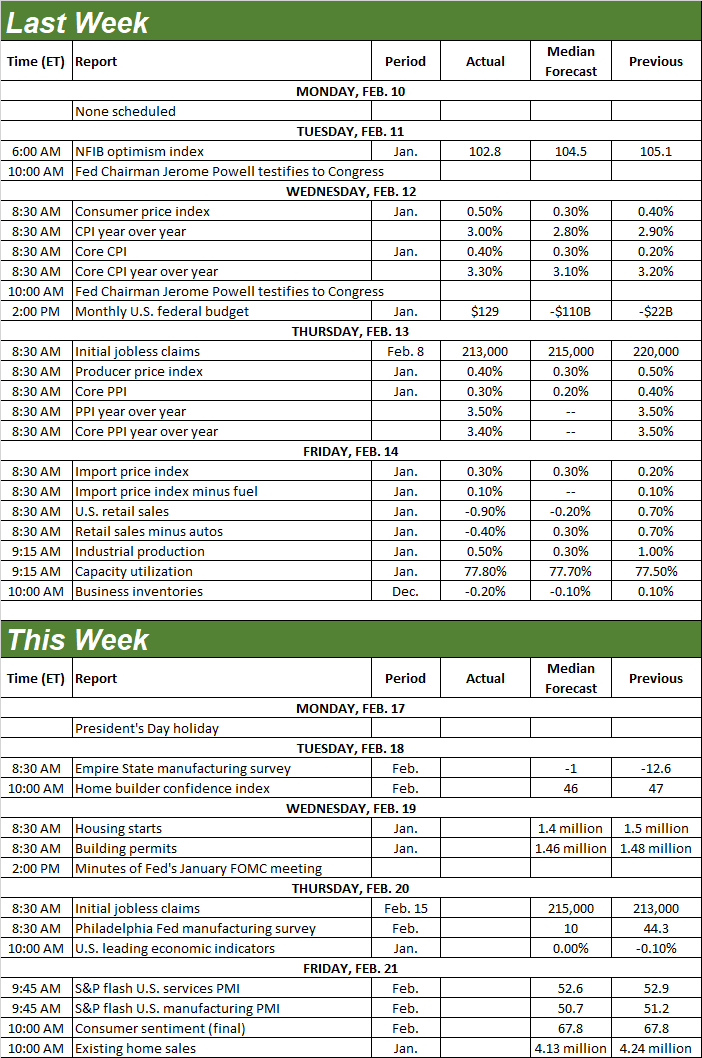
Source: Briefing.com, TradeStation
This holiday-shortened week starts in earnest on Wednesday, when January’s housing starts and building permits numbers are due. Economists are calling for a measurable cooling this time around, particularly for starts that soared a month earlier. On balance, the real estate market remains subdued at 2023’s and 2024’s lethargic levels.
Housing Starts and Building Permits Charts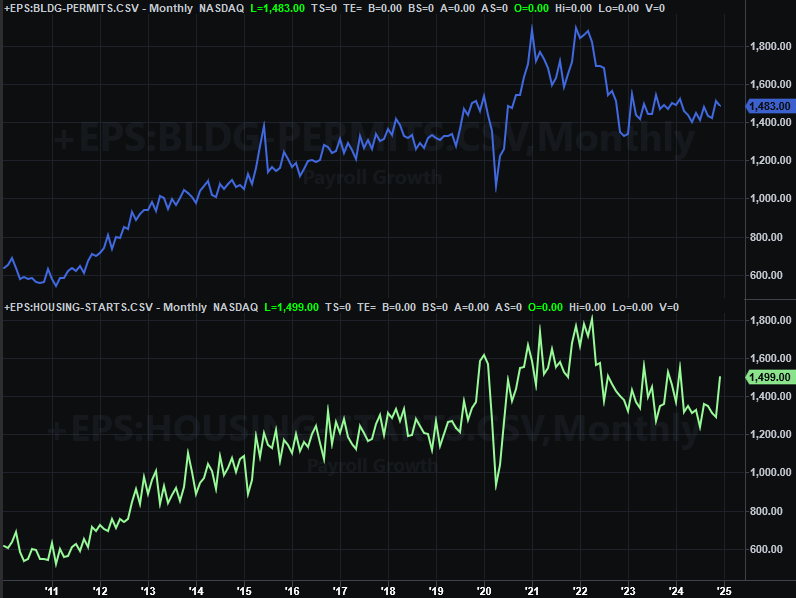
Source: U.S. Census Bureau, TradeStation
The current real estate report card will be further rounded out on Friday, with January’s existing home sales data from the National Association of Realtors. They should be down just a little as well. Again, these numbers don’t exactly point to strength above or below their current levels.
New, Existing Home Sales Charts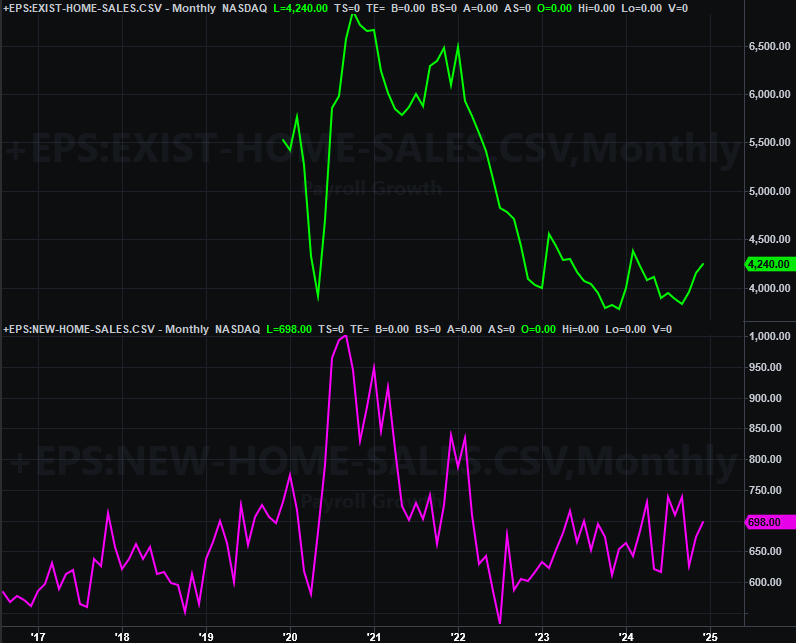
Source: National Assn. of Realtors, U.S. Census Bureau, TradeStation
Note that last month’s new home sales numbers will be released next week.
Also on Friday look for the third and final update of the University of Michigan’s consumer sentiment reading for February. Like most everything else, look for a lull here. Consumer confidence has clearly been tepid of late, with the impact of inflation and sheer uncertainty slowly grinding people down.
Consumer Sentiment Charts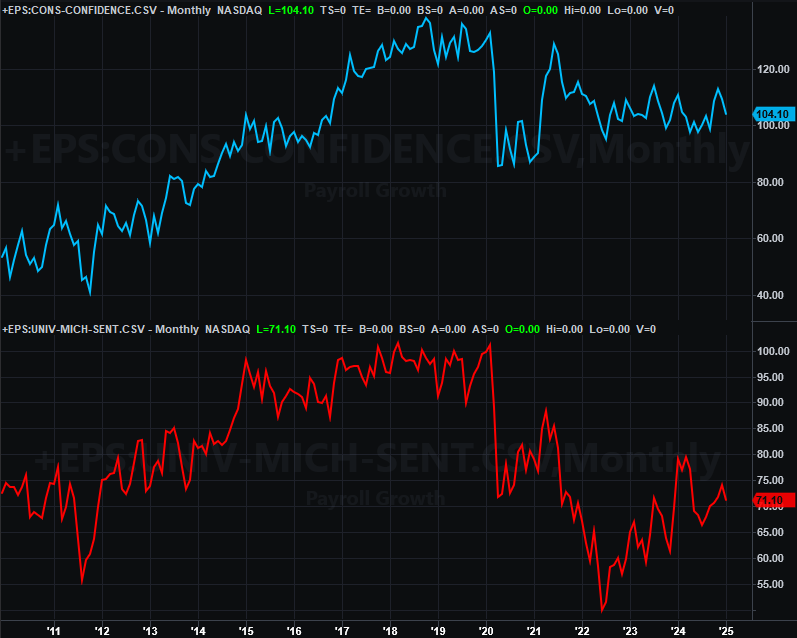
Source: University of Michigan, Conference Board, TradeStation
The Conference Board’s consumer confidence measure for this month will also be posted next week.
Stock Market Index Analysis
The bulls notched their second weekly win in a row. Indeed, while far from thrilling, the intraweek turnaround took shape exactly where the bulls would want it to, further defining yet-another technical support level that can be leveraged in the future.
The spot where things took a turn back for the better for the S&P 500 is right at the 50-day moving average line (purple) just above 6,000. Wednesday’s low only had to kiss that level (circled on the daily chart of the S&P 500 below) to shift back to buying mode again… which remained in place all the way through Thursday’s close. Friday didn’t help, but it didn’t need to. The index ended up gaining a respectable 1.4% last week. Wednesday’s low also become a third node for what’s now clearly becoming rising technical support (orange, dashed) connecting the big low from early January and the beginning of February.
S&P 500 Daily Chart, with VIX and Volume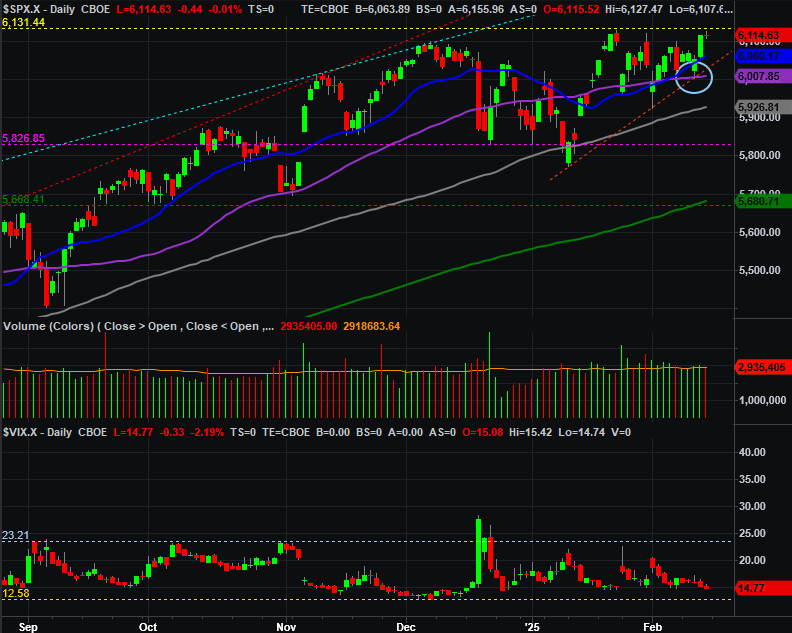
Source: TradeNavigator
There’s still one noteworthy, curious concern here. That’s Friday’s high of 6,134, which aligns perfectly with January’s record high (yellow, dashed). Have the bulls drawn a mental line in the sand at this level? Maybe.
Either way, the index is being squeezed into a point by rising support and horizontal resistance. One or the other will have to break soon. As it stands right now, it looks like it’s the ceiling that will ultimately give way to the bullish effort. Bolstering this argument is the simple fact that the index remains within decidedly-bullish guardrails on the weekly chart below, steering it higher.
S&P 500 Weekly Chart, with VIX and MACD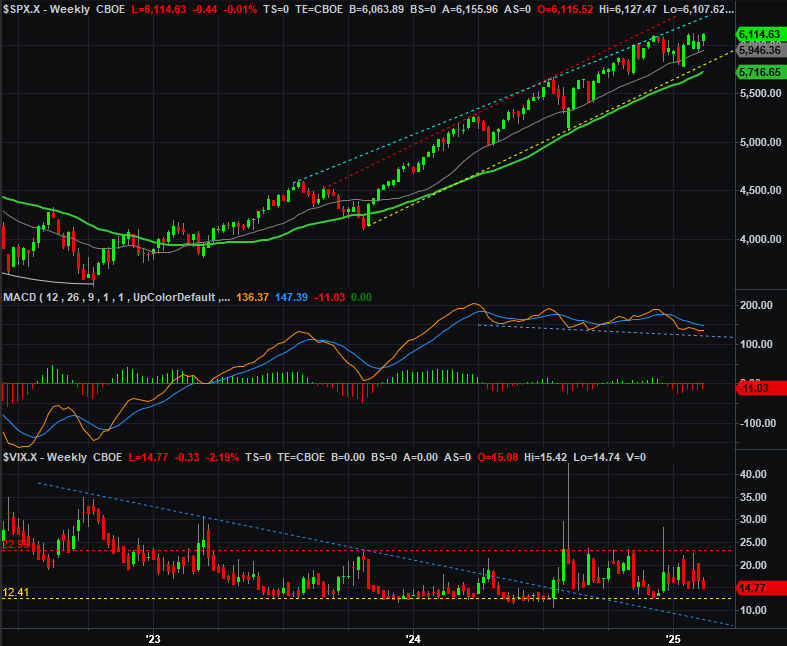
Source: TradeNavigator
The NASDAQ Composite’s chart looks similar, but not identical. Like the S&P 500, it pushed up and off of a rising support line that connects all the key lows since early January (light blue, dashed). Unlike the S&P 500 though, the NASDAQ didn’t quite test a record high. It instead confirmed there’s a falling resistance line (orange, dashed) connecting the key peaks since December. The end result? The composite is getting squeezed into the tip of a converging wedge.
NASDAQ Composite Daily Chart, with VXN and Volume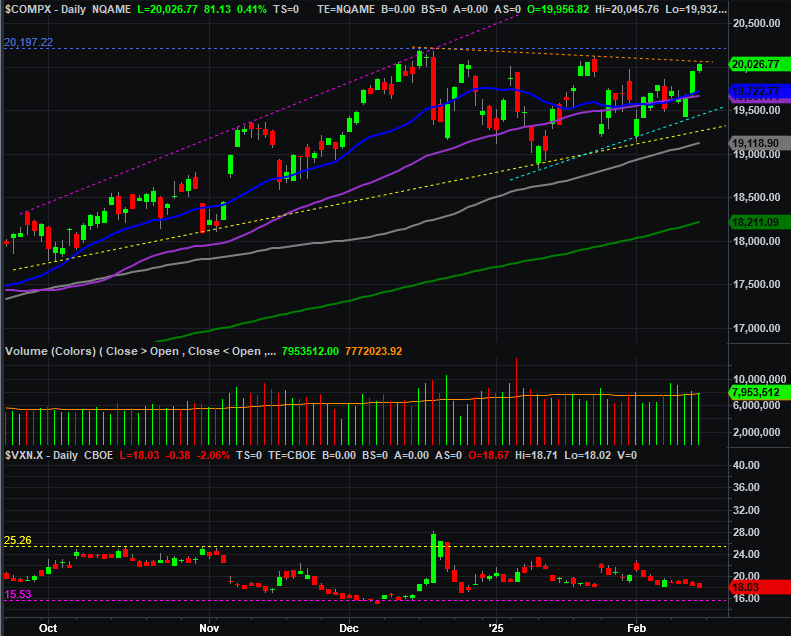
Source: TradeNavigator
That being said, it would be amiss to not also point out that the volume behind last week’s successfully-bullish effort is at least above average. This of course bolsters the bullish argument.
The weekly chart of the NASDAQ Composite below puts things in more perspective, reminding us that — like the S&P 500 — the composite is still ultimately being steered by a rising channel that’s been in place since early-2023. The only truly bearish aspect here is the fact that the index is nearer the upper boundary of this channel than the lower one, leaving some room for downside even without breaking the bull market.
NASDAQ Composite Weekly Chart, with VIX and MACD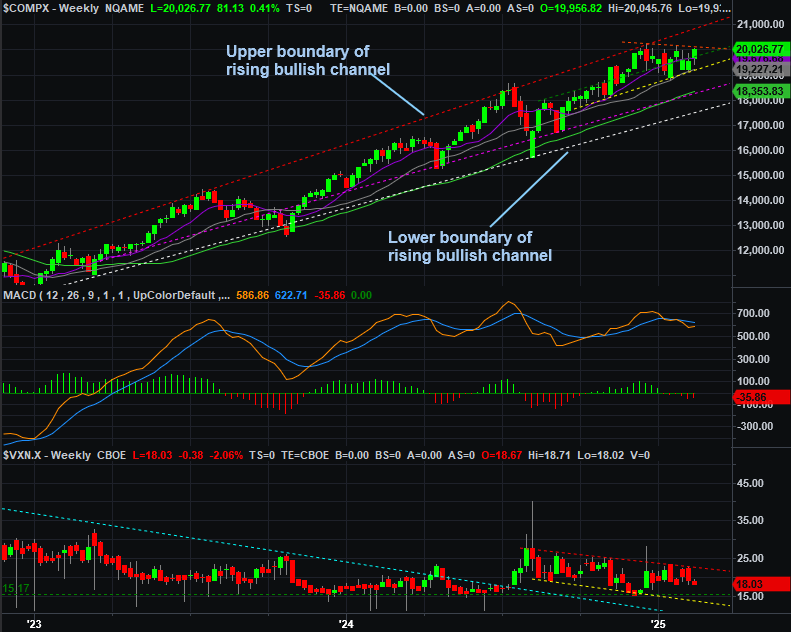
Source: TradeNavigator
Caution remains the top priority. The market’s lingered higher for a little too long without any serious correction. In this same vein, both volatility indexes (the VXN and VIX) have lingered at uncomfortably low levels for a bit too long as well. Something’s got to give sooner or later.
There’s no clear evidence that this stumble is set to happen now or in the immediate future though. The market is finding technical support in all the right place. Now let’s just see if the indexes can punch through the technical resistance they only tested last week. If so, that should spark something of a rally effort that could ultimately test the upper boundaries of both long-term rising trading ranges.