
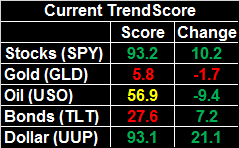
 [1] Despite the rough start to the trading week, the bulls once again found a way to snatch victory from the jaws of defeat. Initially following through on the previous week's bearish ending, the S&P 500 mustered a 0.7% gain last week. It's not a game-changer, but it keeps the long-toothed uptrend moving.
Still, though it was mostly earnings that prodded the overall market higher last week – a raucous week, by the way – there's still more than enough geopolitical tension in the air to pull the rug out from underneath the advance. We have to be ready for anything, knowing August isn't a great month for stocks (and knowing July was an unusually bullish one).
We'll slice and dice it all. First, however, let's review last week's and preview this week's economic announcements.
Economic Data
What a week? Not just for stocks, but in terms of economic news. We'll have to limit ourselves to just the highlights, which end with the grand finale of Friday's jobs report. (Spoiler alert: It was good.)
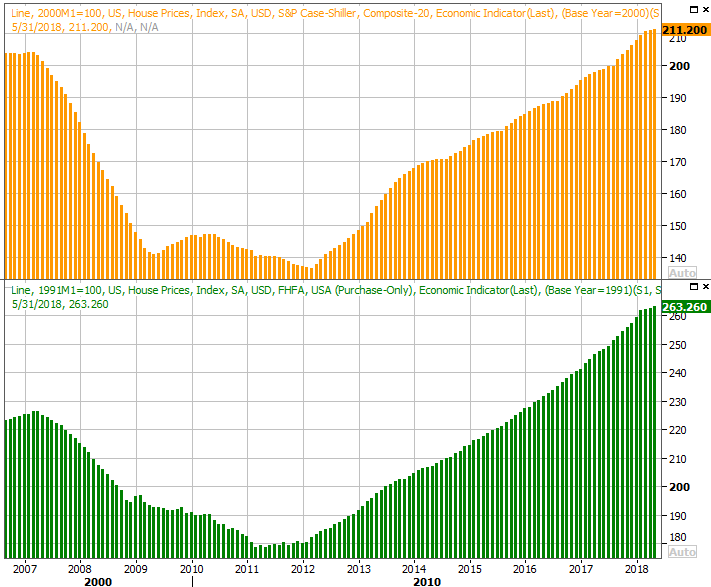
The party got going in earnest on Tuesday, with a look at May's Case-Shiller Home Price Index (which rounds out the prior week's look at the FHFA home price index). They were up, adding a bullish dimension to an otherwise alarming trend within the housing market – sales activity is falling, and not due to a lack of inventory.
Home Price Charts
 [2]
[2]
Source: Thomson Reuters
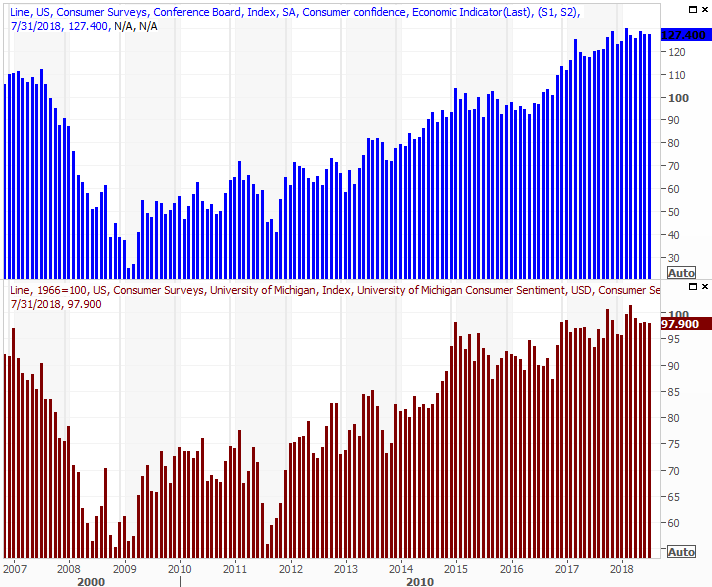
Consumer sentiment is still rock-solid. The Conference Board's consumer confidence measure rolled in better than the expected 126.6, hitting 127.4. Both it and the Michigan Sentiment Index continue to trend upward, though are clearly slowing down. Then again, both are largely slowing down because they're near their plausible maximum levels. Until we see clear downtrends develop, the slowing trends are still bullish.
Consumer Sentiment Growth Charts
 [3]
[3]
Source: Thomson Reuters
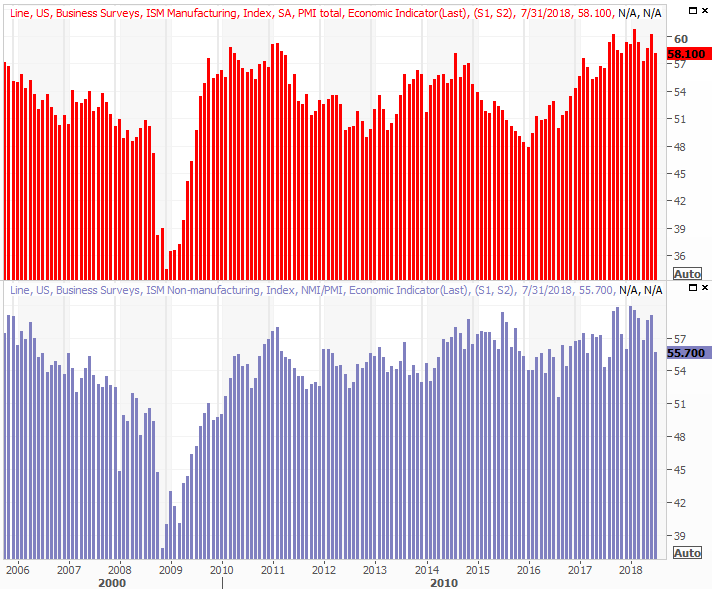
On Wednesday we got last month's ISM Manufacturing data, followed by the ISM Services report on Friday. Both fell from June's levels, and both came up short of expectations. Both remain reasonably healthy though, and are not a concern yet… not even close.
ISM Index Charts
 [4]
[4]
Source: Thomson Reuters
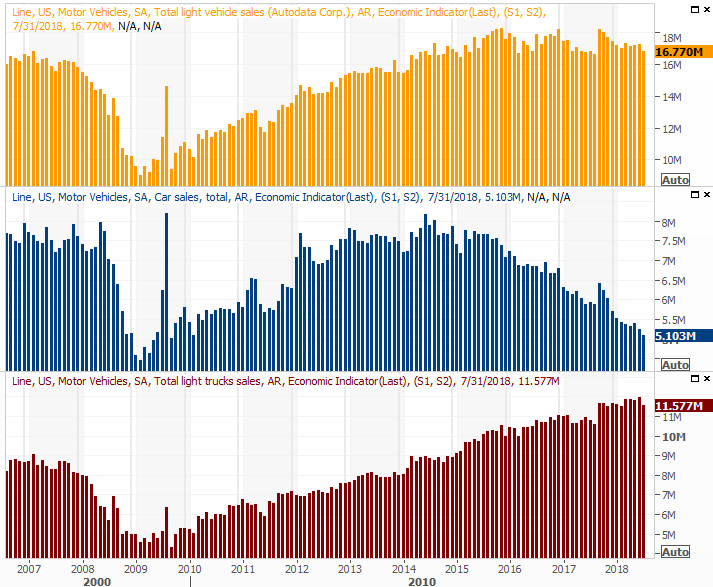
Also on Wednesday we got last month's auto sales figures… at least from the company's that still report them. July wasn't a fantastic month for the automobile business. Total sales fell to a pace of 16.77 million, which was the lowest pace since August of last year. The trend, more important, continues to deteriorate.
Auto Sales Charts
 [5]
[5]
Source: Thomson Reuters
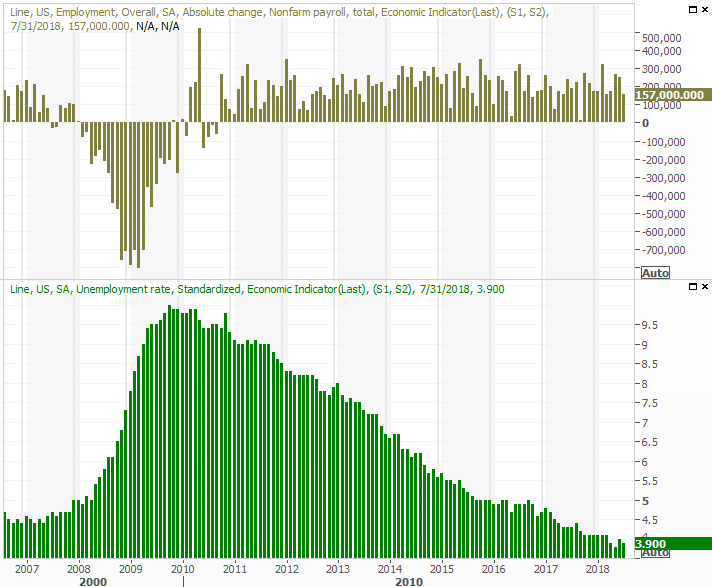
Finally, last week's big news, of course, was July's employment report posted on Friday. The country added 157,000 new payrolls, missing expectations, but still managing to send the unemployment rate from 4.0% to 3.9%.
Payroll Growth, Unemployment Rate Charts
 [6]
[6]
Source: Thomson Reuters
A quick glance at the headlines wasn't all that compelling, but we explored the matter in detail at the site, explaining how the headline numbers were deceptively ho-hum. The jobs picture is quite strong, as you can read for yourself here: https://www.bigtrends.com/stocks/julys-jobs-report-literally-couldnt-have-been-any-better/
Everything else is on the grid.
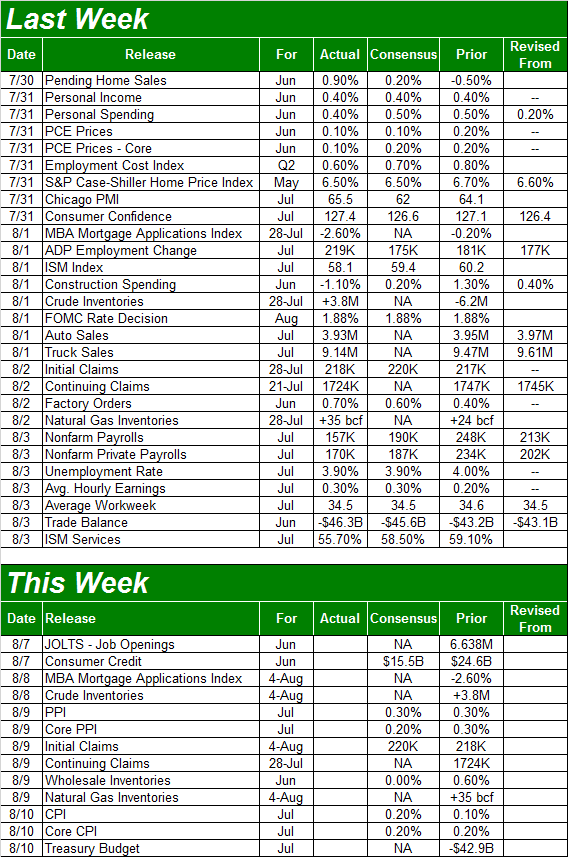
Economic Calendar
 [7]
[7]
Source: Briefing.com
This week won't be nearly as busy, which is good. Between last week's economic news and two head-spinning weeks of earnings announcement, a little less excitement will let traders regroup. There is one noteworthy economic announcement on the schedule though. It comes in two parts. On Thursday we'll hear about last month's producer inflation, and on Friday we'll get last month's consumer inflation report. Analysts are looking for more of the same increases we've seen of late, on both fronts.
Inflation Charts
 [8]
[8]
Source: Thomson Reuters
It's worth watching both reports simply because they'll be a key part of the information the Fed considers when making their next interest rate decision. They opted not to raise rates last week when they had a chance to do so, but the odds say we'll probably see two more rate hikes before the end of the year.
The next chance for the FOMC to do so is late-September.
Index Analysis
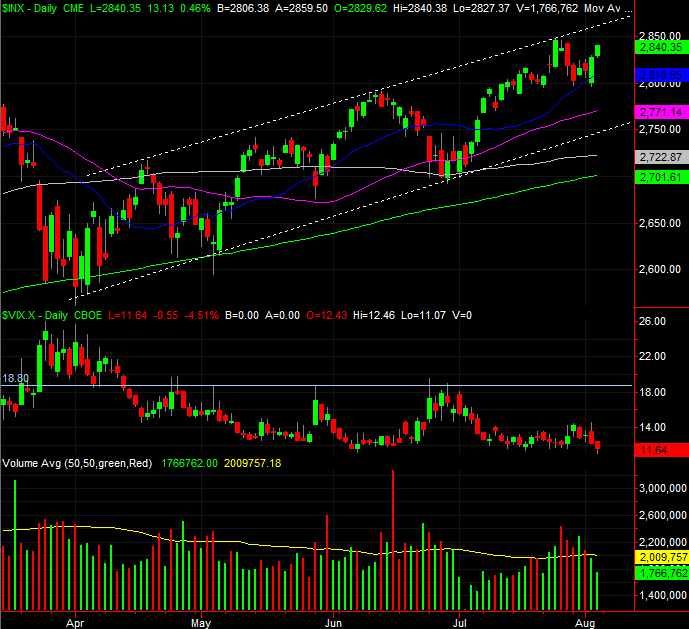
Just when it looked like stocks were about to fall off the cliff on Wednesday, the bulls came to the rescue to rekindle the bigger-picture rally.
Still, this is far from the ideal kind of bullishness. There's still a major ceiling ahead, and the VIX is back to its near-absolute low. Perhaps worst of all, Thursday's bullish volume was below average, and Friday's bullish volume was lower than Thursday's. This isn't necessarily a majority opinion.
S&P 500 Daily Chart, with VIX and Volume
 [9]
[9]
Source: TradeNavigator
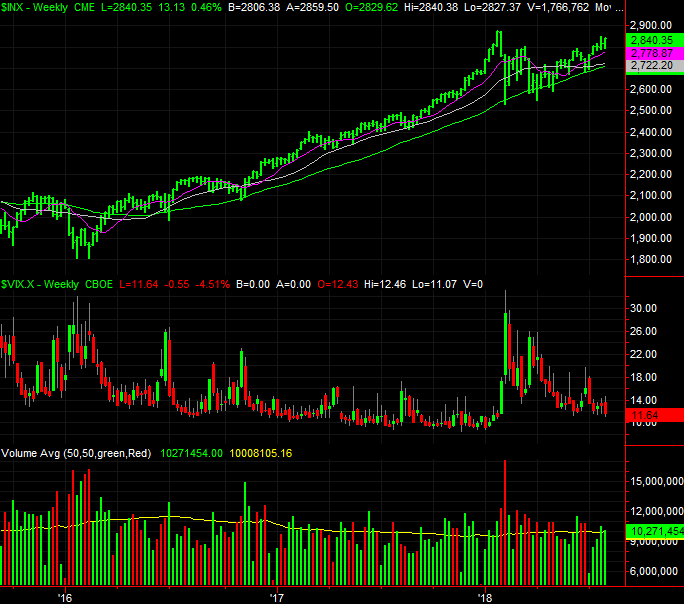
Then again, when we zoom out and take a look at the long-term weekly chart of the S&P 500, we can see the past few months doesn't look too terribly different than the kind of action we were seeing in late 2015 and early 2016. That turbulence was ultimately a setup for a persistent rally that – for the better part of late 2016 and early 2017 – was "supposed to go through a correction." The correction never really happened until early 2018.
S&P 500 Weekly Chart, with VIX and Volume
 [10]
[10]
Source: TradeNavigator
The point is, as unlikely as it seems, we can't assume we won't get the kind of prolonged rally we saw in 2017 as we move deeper into the latter half of 2018. Stranger things have happened (and not that long ago).
If that's going to happen though, earnings are going to be a factor. To that end…
We're about three-fourths of the way through Q2 earnings season, and so far, so good. The S&P 500 is on pace to report a final second-quarter earnings tally of $38.80, translating into a four-quarter trailing EPS of $140.52, and a trailing P/E of 20.2. The forward-looking (next four quarters) P/E of 17.0 is healthy too. That leaves some room for forward progress, though it remains to be seen just how much. Rising interest rates are also working against the kind of valuation investors will tolerate.
But, first things first. The S&P 500 may be rising, but it's still got a technical ceiling dead ahead. That's the rising support line (dashed, on the daily chart above) around 2864, and rising a little every day. The bears will get another chance to turn the rally around there, and the oddly low VIX will only help keep a lid on things.
Of course, one misstep on the geopolitical-relations front could just as easily pull the rug out from underneath the rally. Keep your eyes peeled for all possibilities, even more than usual.