
Stocks may have stumbled a couple weeks back, cooling off from their post-election rally. But, the selling remained in check last week. The market pushed up and off key technical support, in fact, rekindling the bigger-picture rally that’s actually been underway since late-2022. The indices are back within sight of record highs, and still moving toward them.
And there’s room for more bullishness from here. It’s almost perfectly choreographed with the calendar, in fact.
We’ll show you what that means in a moment. First, work through last week’s economic news and preview what’s lined up for this holiday-shortened week.
Economic Data Analysis
There wasn’t a lot of economic news dropped last week, but most of what we got was real estate related.
Take Tuesday’s look at October’s housing starts and building permits as an example. As expected, both were more or less in line with September’s figures. More important, both starts and permits remain stuck at relatively lackluster levels. Although new home sales are technically on the rise (more on this in a moment), new construction doesn’t actually seem to be accelerating.
Housing Starts and Building Permits Charts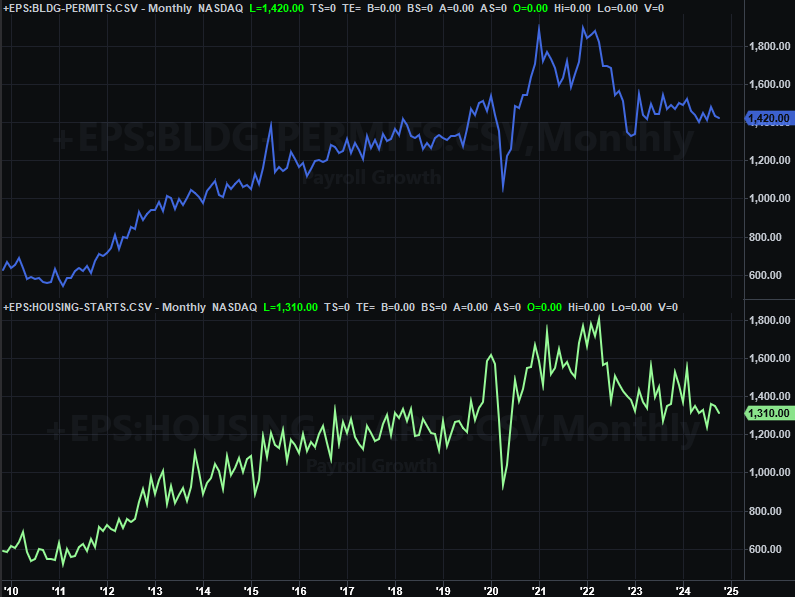
Source: Census Bureau, TradeStation
In this vein, sales of existing homes ticked a little higher last month, but only a little. They’re still fairly tepid as well.
New, Existing Home Sales Charts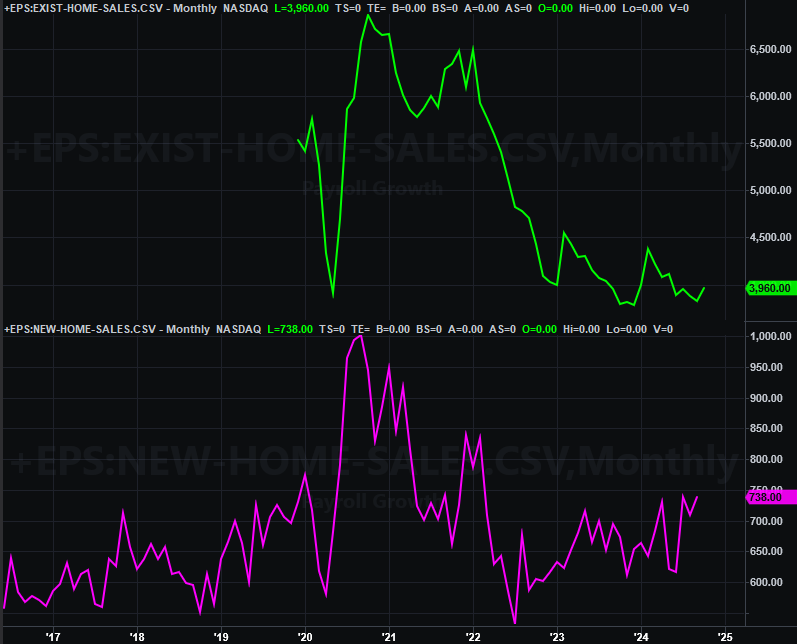
Source: Census Bureau, TradeStation
October’s sales of new homes will be reported on Tuesday of this week. These have been better more often than not since the beginning of this year, but like most other things, are still at tepid levels. Economists believe we’ll see a slight tumble back to 720,000 this time around. This (mostly) jibes with the aforementioned starts and permits.
Everything else is on the grid.
Economic Calendar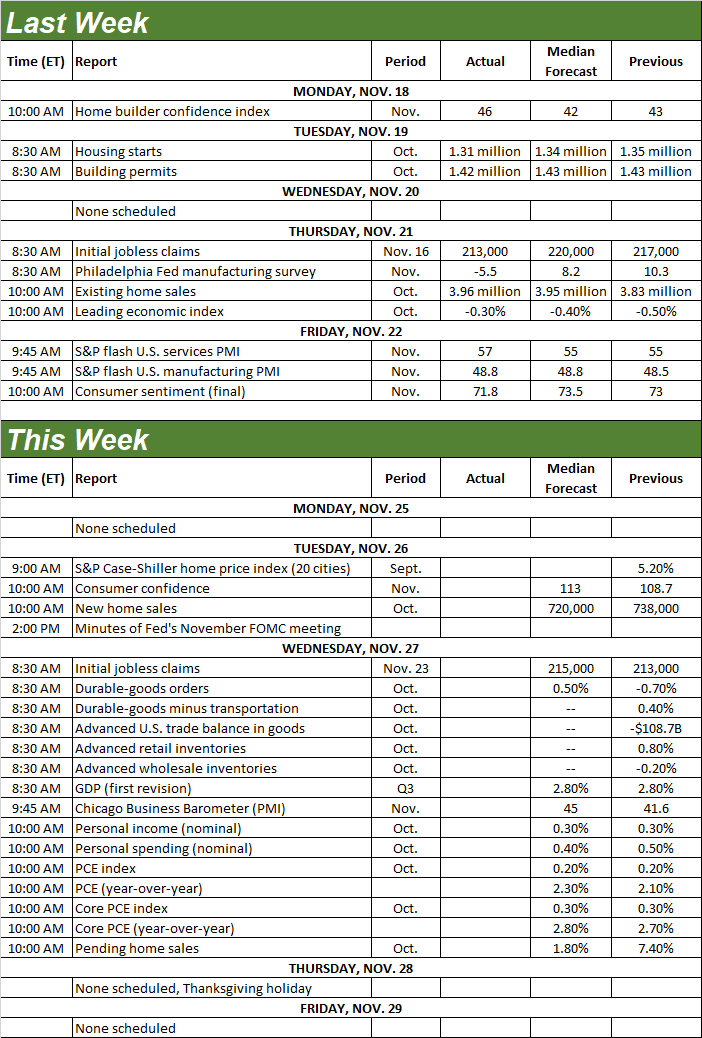
Source: Briefing.com
Although this week is going to be abbreviated by the Thanksgiving holiday, there’s a lot of information that’s going to be packed into just a couple of days.
Tuesday is one of those days, with the Case-Shiller Index and the FHFA Home Price Index poised to round out the real estate picture. Although these numbers will only be for September, they’ll still be telling. Notice there’s a bit of a disparity here, with the Case-Shiller Index cooling off while the FHFA measure is still fighting its way higher.
Home Price Charts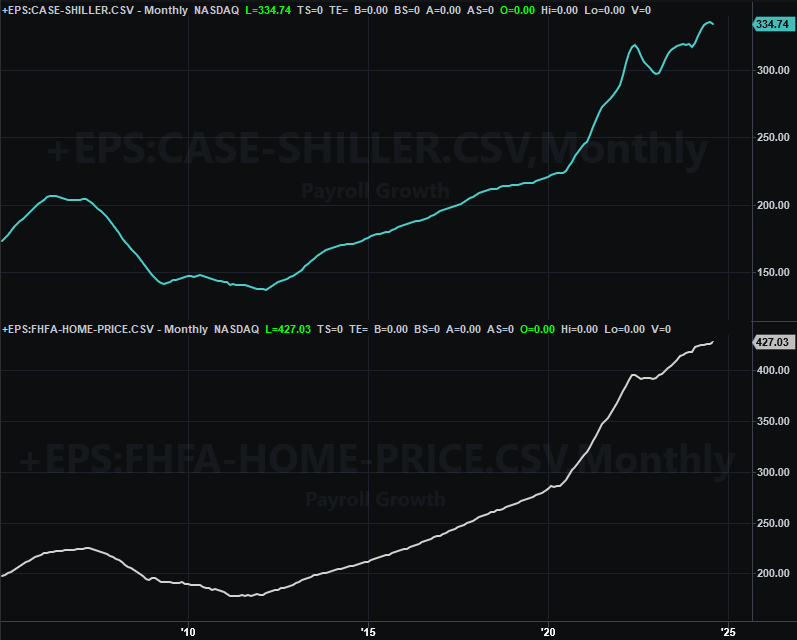
Source: Standard & Poor’s, FHFA, TradeStation
Also on Tuesday of this week we’ll hear the Conference Board’s consumer confidence score for November. You may know last week’s third and final update of the University of Michigan’s consumer sentiment index ended up showing a weaker improvement than expected (rising only to 71.8). Economists believe the Conference Board’s measure will show more improvement, extending last month’s progress.
Consumer Sentiment Charts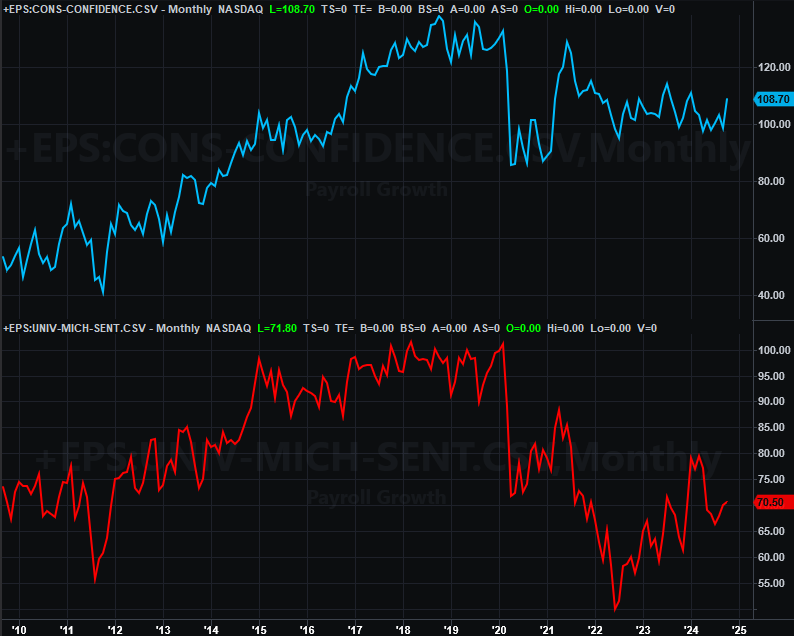
Source: Conference Board, University of Michigan, TradeStation
Finally, although we’re not charting it here, on Wednesday look for last month’s consumer spending and personal income report for October. This is data the Federal Reserve considers when making interest rate decisions… and the odds of a rate cut next month seem to be shrinking. Forecasts suggest we’ll see more of the same, which is continued — albeit moderate — spending that suggests inflation isn’t exactly abating.
Stock Market Index Analysis
A week ago the bears were pushing back against the post-election bullish bump. But, the sellers were also bumping into a floor. They pushed up and off of it last week, reigniting the bigger-picture rally.
That technical floor is the 20-day moving average line, plotted in blue on the daily chart of the S&P 500 below. The selling was halted there two weeks back, and this line proved to be a pushoff point last week to drive the index higher to the tune of 1.7%. That didn’t translate into a record high, but the market is back within sight of that mark. From a momentum perspective, things are bullish.
S&P 500 Daily Chart, with VIX and Volume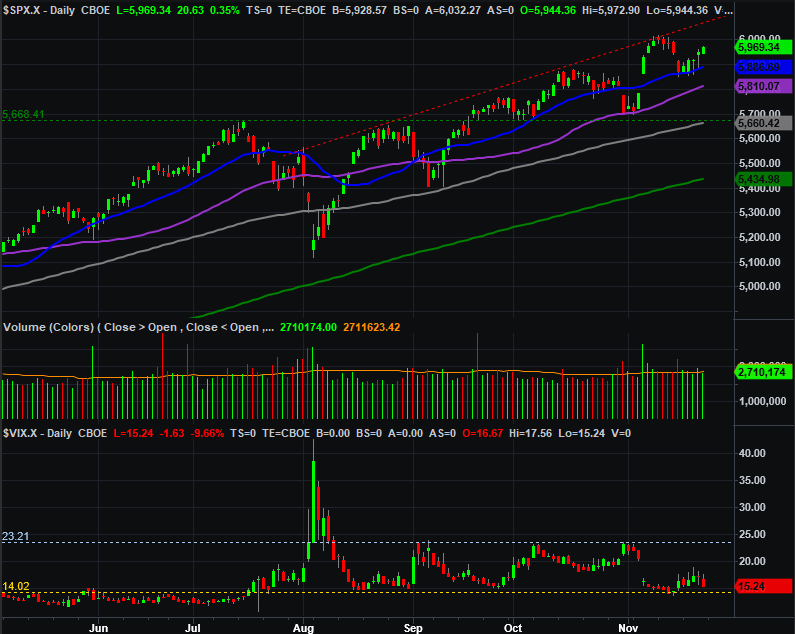
Source: TradeNavigator
The NASDAQ Composite dished out similar action. As its daily chart shows us below, the 20-day moving average line was at least something of a frontline, even if not perfectly so. More than that, though, the composite found straight-line support at the line that connects all the major lows since early August (yellow, dashed).
NASDAQ Composite Daily Chart, with VXN and Volume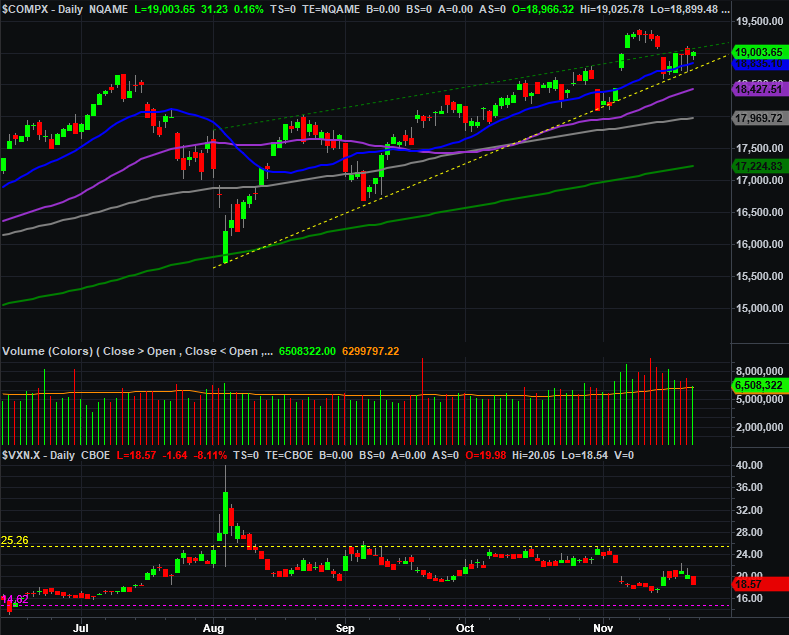
Source: TradeNavigator
The daily chart of the composite shows us something else interesting though. Although not a perfect one, it’s being squeezed upward into the tip of a converging wedge that’s just above at its end. There’s very little room left for the NASDAQ to bounce around within it.
The weekly chart of the NASDAQ Composite puts things in a little more perspective. From this vantage point we can see that while the index is moving higher within a short-term converging wedge (yellow and green lines), it’s also moving higher within a longer-term diverging channel (red and white lines). These channels support one another. More important, the upper boundary of this longer-term bullish trading range currently stands at 20,350, but will be at 20,450 before it could be tested.
NASDAQ Composite Weekly Chart, with VIX and MACD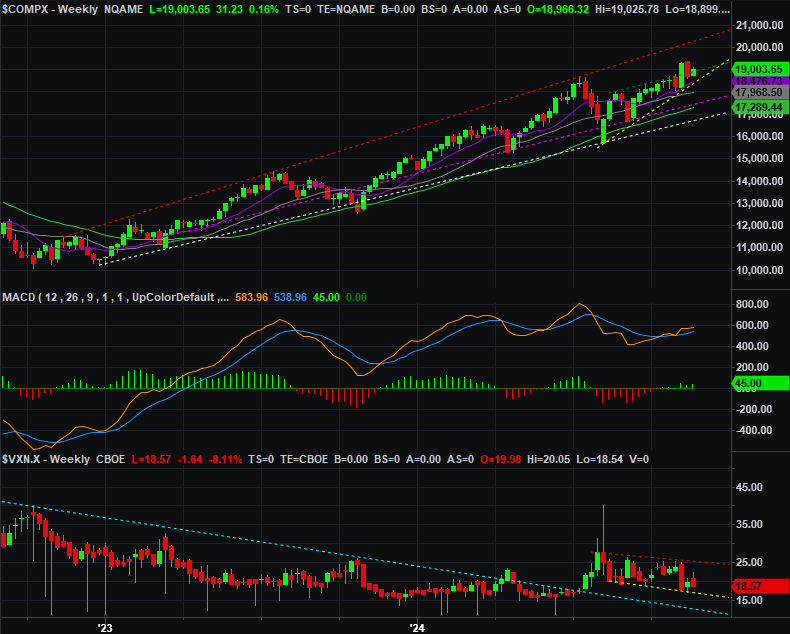
Source: TradeNavigator
And again, the momentum right now is bullish. We’re also at a bullish time of year. Also notice that the MACD lines in the middle of the chart above are showing a clear bullish divergence. Additionally, there’s at least a little room for the NASDAQ Volatility Index (VXN) to continue inching lower, which in and of itself provides room for further market upside.
The S&P 500 has similar upside with a similar amount of room. Its long-term technical ceiling on the weekly chart below currently stands at 6,050, although there’s another one (red, dashed) at 6,160. Both are obviously rising too.
S&P 500 Weekly Chart, with VIX and MACD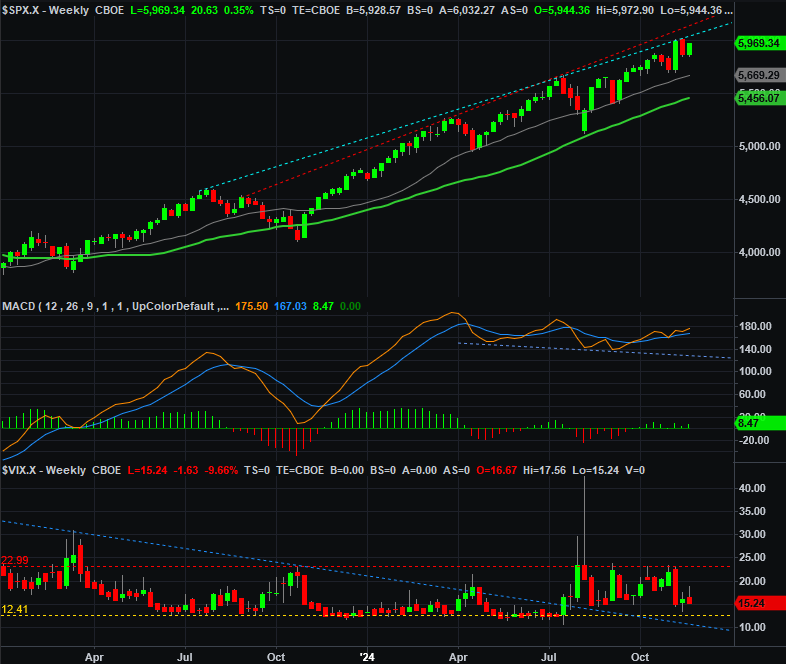
Source: TradeNavigator
With nothing more than last week’s action to consider, one has to be bullish. This is far from the scenario one would like to see bullishness within, however. Stocks are technically overbought, and the market itself is overvalued at 23.5 times its forward-looking earnings. The market needs a healthy correction here, but isn’t ready to make that happen… at least not yet. Any continued gains in the near future will of course only make the eventual correction that much bigger.
But first things first. This bullishness looks like it’s going to have to fully play out first.