
The holiday-shortened trading week may have gotten off on a bullish foot, but as feared, when push came to shove, the bulls weren’t ready to take the leap. After testing a major technical ceiling, the bulls backed down. The S&P 500 fell 1.5% last week, closing more than 3% below Monday’s high. The NASDAQ Composite slipped 5% from peak to trough, logging a loss of 2.7% for the full trading week.
So now what? The bigger trend remains bearish. But, that bearishness comes with a key footnote. That is, the volatility indexes (VIX and VXN) also edged lower last week, suggesting traders may not be quite as worried as they were a couple weeks ago when tariffs turned into terror. The volume behind last week’s weakness was also relatively light. We may not be in a new full-blown uptrend yet, but it’s possible the most harrowing piece of the correction is in the rearview mirror. That will at least make it easier to muster a rebound (perhaps without making the true capitulation we’d really rather see).
We’ll look at everything in some detail below. First, let’s look at last week’s biggest economic announcements and preview what’s coming this week.
Economic Data Analysis
Fairly busy week last week, with lots of mixed messages.
The party started in earnest on Wednesday, with a look at last month’s retail sales. You may recall they took a slight unexpected dip in January and then bounced back in February. They grew again last month… pretty nicely too. It appears that at least consumers are doing what they can to keep things moving. Or, it might be more accurate to say consumers aren’t too terrified to let go of at least some of their discretionary dollars.
Retail Sales Charts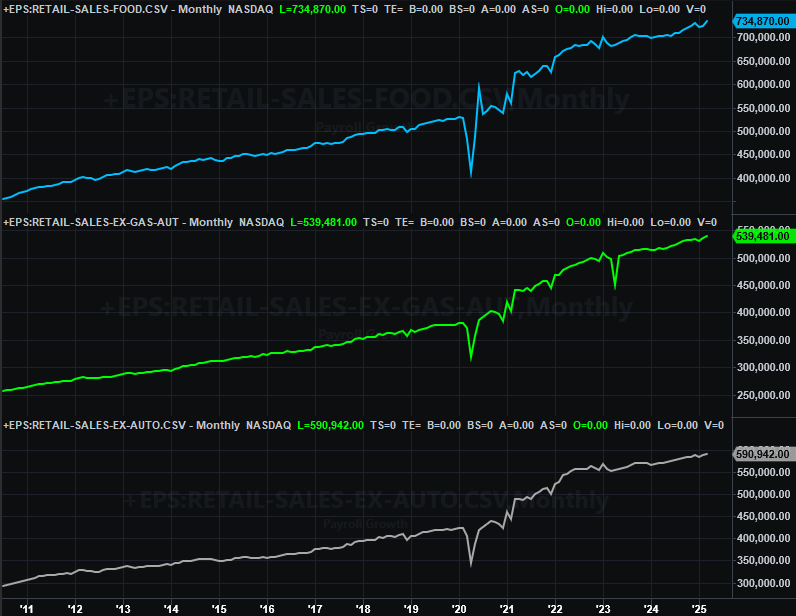
Source: Census Bureau, TradeStation
The same can’t necessarily be said of the nation’s factories. After a reasonably healthy runup since December, industrial production as well as the utilization of the nation’s production capacity both slipped in March.
Capacity Utilization, Industrial Production Charts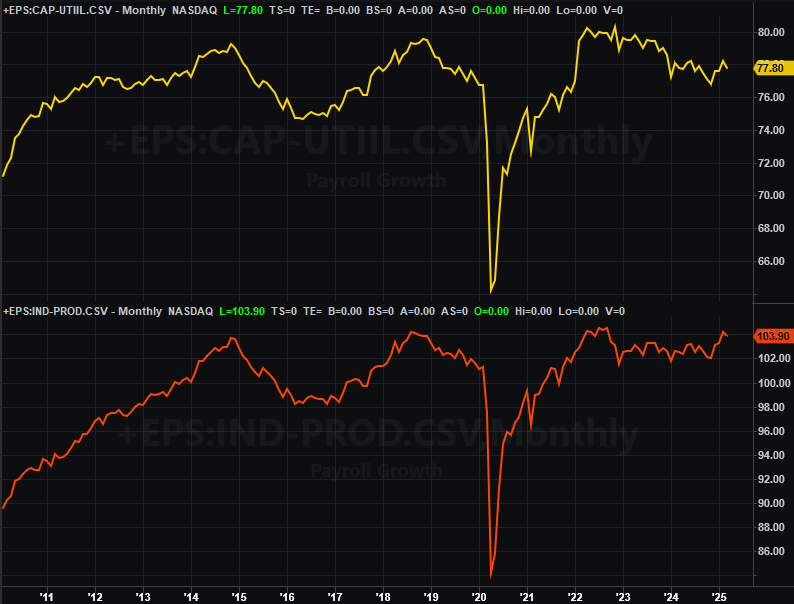
Source: Federal Reserve, TradeStation
One bad month doesn’t make a trend. But, all trends start with one bad month. We’re still net-positive here overall, but this is certainly data we’ll want to keep an eye on… given the degree of sudden economic disruption.
In this vein, housing starts and building permits are sending a mixed message. Last month’s permits ticked a bit higher, while March’s starts took a decent-sized tumble. Mostly, the real estate market seems like it’s just stuck on the fence. That’s still a problem though. It’s leveling off at subpar levels when we really need to see at least a bit of forward progress.
Housing Starts, Building Permits Charts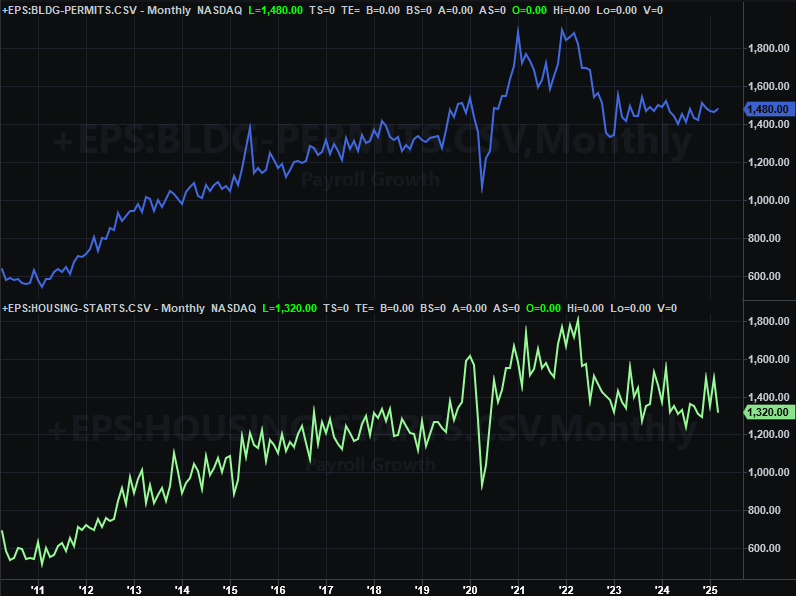
Source: Census Bureau, TradeStation
Everything else is on the grid.
Economic Data Report Calendar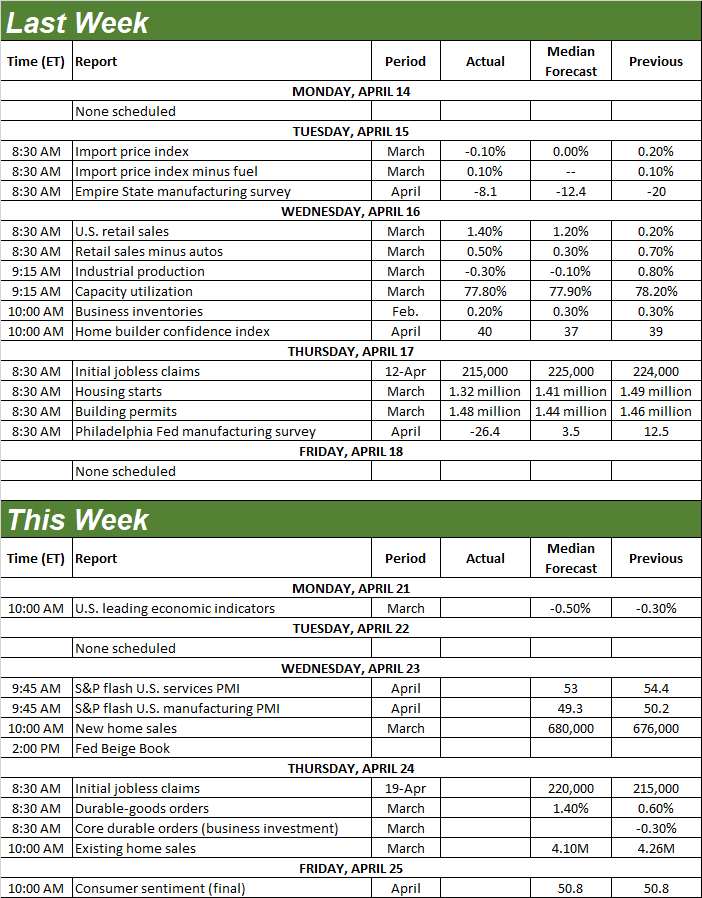
Source: Briefing.com, TradeStation
The real estate picture will be rounded out this week. On Wednesday we’ll hear March’s new home sales figure, with existing home sales coming on Thursday. Sales of newly-built houses are expected to tick just a bit higher from February’s lethargic levels, while sales of existing homes are likely to slow down again, calling into question what looked/looks like a budding turnaround effort.
New, Existing Home Sales Charts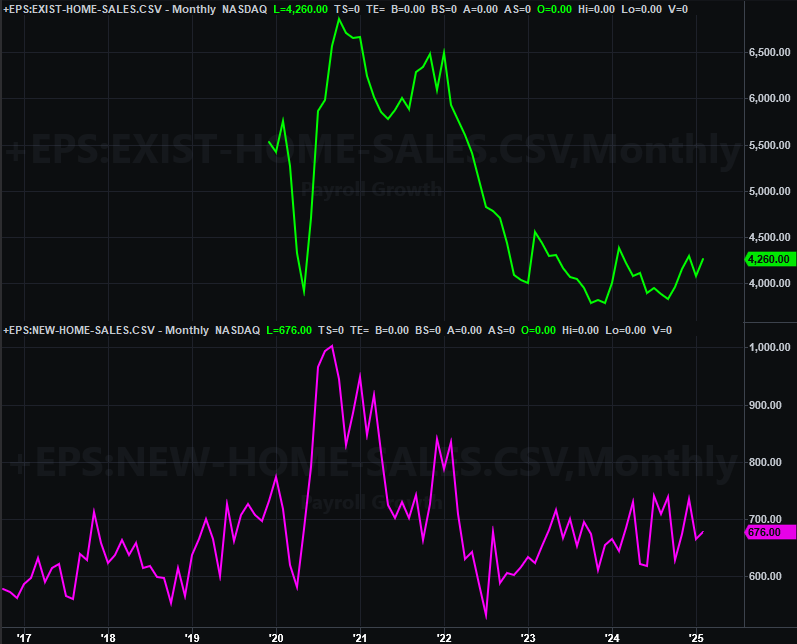
Source: National Assn. of Realtors, Census Bureau, TradeStation
Again, we need this recovery in home sales to confirm that the economy is firming up.
On Friday we’ll get the third and final look at last month’s consumer sentiment from the University of Michigan. Last month’s sentiment plunged to a multi-month low of 57.0. It will likely roll in lower yet again, to 50.8.
Consumer Sentiment Charts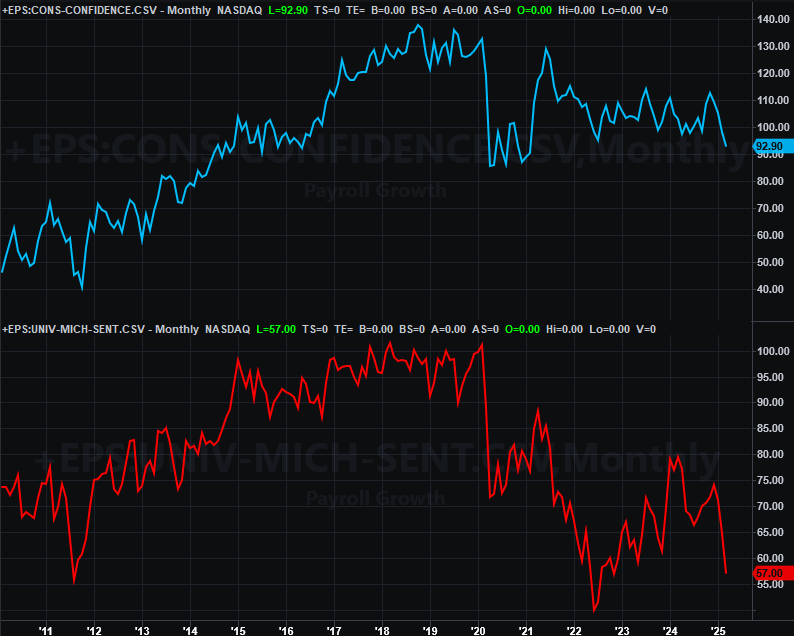
Source: Conference Board, University of Michigan, TradeStation
The Conference Board’s consumer confidence number won’t be reported until next week. But, it’s likely to follow suit, also following March’s similar plunge.
While alarming, this isn’t exactly the worst-possible thing. While not laser-precise, extreme pessimism tends to take shape at or near market bottoms. We’ll see.
Stock Market Index Analysis
The bulls did their best to follow through on the bullish end to the previous week, starting last week with a solid jump. The bears pounced pretty quickly though, and never looked back. Monday’s high came right where you’d expect it to as well. That’s the 20-day moving average line, plotted in blue on the daily chart of the NASDAQ Composite below. The index touched first thing on Monday morning, kicking off modest selling that never really let up.
NASDAQ Composite Daily Chart, with VXN and Volume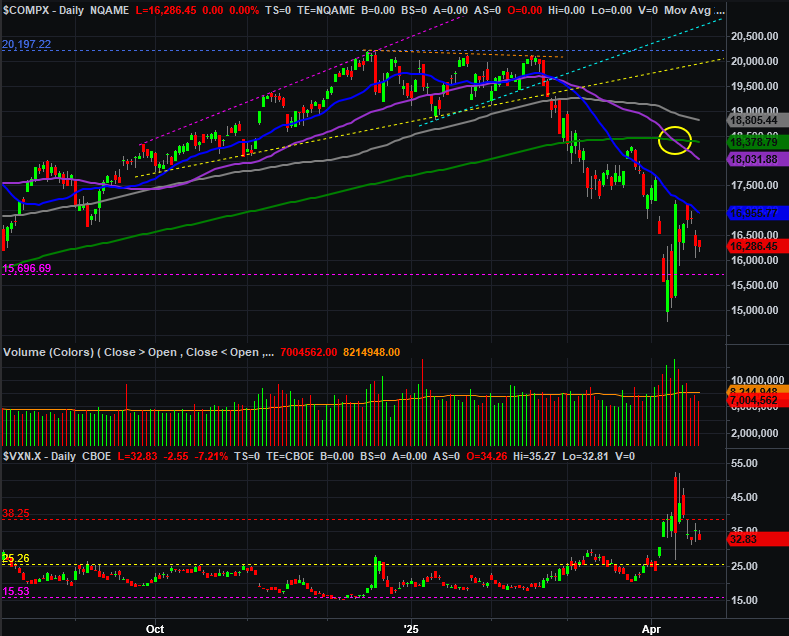
Source: TradeNavigator
The S&P 500’s action looks almost identical, although it didn’t quite test its 20-day moving average line with Monday’s strong open, it got close.
S&P 500 Daily Chart, with VIX and Volume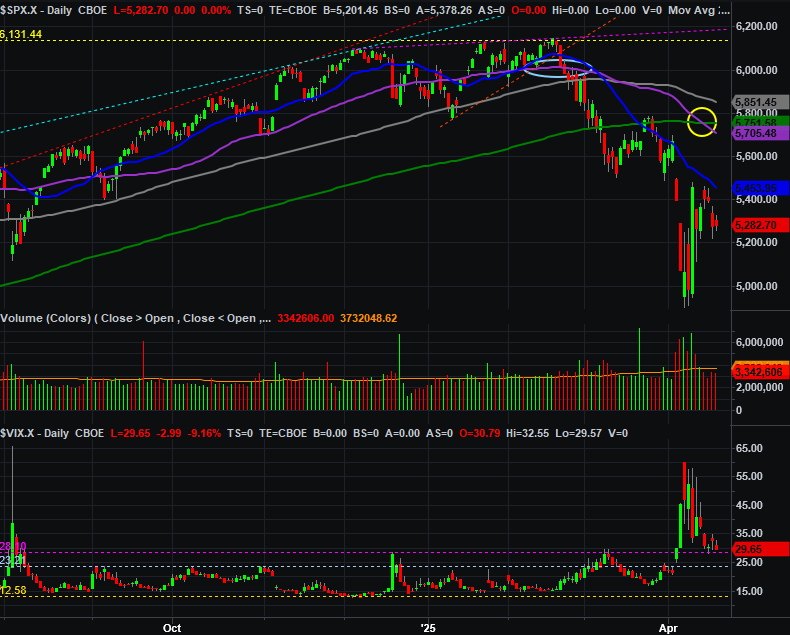
Source: TradeNavigator
Also notice that we now have so-called “death crosses” for both indices (circled in yellow). That’s where the 50-day moving average line (purple) falls under the 200-day line (green), indicating a major turn for the worse.
And this creates something of a wrinkle for traders. There’s room for the market to recover quite a bit, but that won’t necessarily change the market’s current bigger-picture bearish trend here. Both the S&P 500 as well as the NASDAQ could make respectable gains from here and still remain well under the pivotal 200-day moving average line… thus remaining in a bear trend.
There’s a reasonably good chance that’s going to happen too. Despite last week’s loss, the volume behind the pullback was relatively light, suggesting the dip may be more profit-taking than rooted in sheer fear. The bulls just might ease back into stocks if the new week starts off on at least a stable foot. We’ll have to see how things pan out from there.
Here’s the weekly chart of the NASDAQ Composite for a bit more perspective. Notice how dramatically the lower boundary of long-term rising/bullish channel has been wrecked. The damage is so extensive that it’s difficult to use the recent past to figure out the near future.
NASDAQ Composite Weekly Chart, with VXN and MACD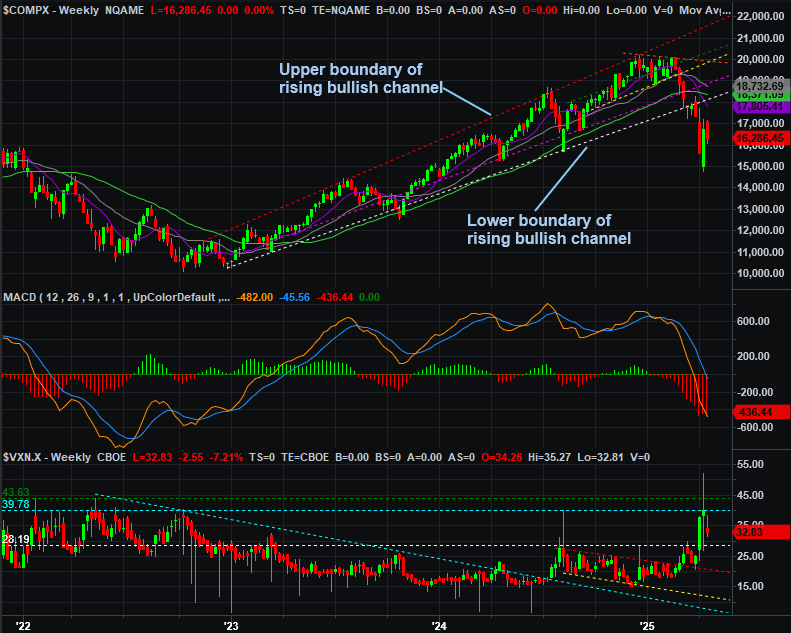
Source: TradeNavigator
The weekly chart, however, shows us something else that says the worst may be over even if the exact, ultimate bottom hasn’t yet been made. Take a look at the volatility index, or VXN. It appears to have peaked, more or less in line with its surge highs from 2022’s bear market, and well before that. As long as there’s room for the VXN to continue falling, there’s room for stocks to keep rising.
So what’s the action plan here? We’re first and foremost trend-followers and momentum traders, so let’s assume there’s more downside ahead… at least until either or both of the indexes can get back above their 20-day moving average lines (if they can do so). Even then however, the 50-day and 200-day moving averages could bring a quick end to any rally effort. And likely would, at least initially. We’d have to clear both of those hurdles before getting all the way back on board the bullish train.
In the meantime though, again, the current trend is bearish, and there’s something seemingly incomplete and unfinished with last week’s lull.