For a short while last week it looked like the market was positioning for a prolonged recovery. But, no dice. While the conflict in Ukraine gets the bulk of the blame, it's arguable that stocks were going to tumble on Friday regardless, rekindling the downtrend that materialized in early January.
There's still a chance the bulls will turn things around. The indices' most important technical support levels are still below them rather than above them. A slow, measured selloff this week could crack those floors though, opening the door to a full-blown correction that will technically qualify as a bear market.
We'll look at those lines in the sand in a moment. First, let's review last week's economic reports and preview the big economic news due this week.
Economic Data Analysis
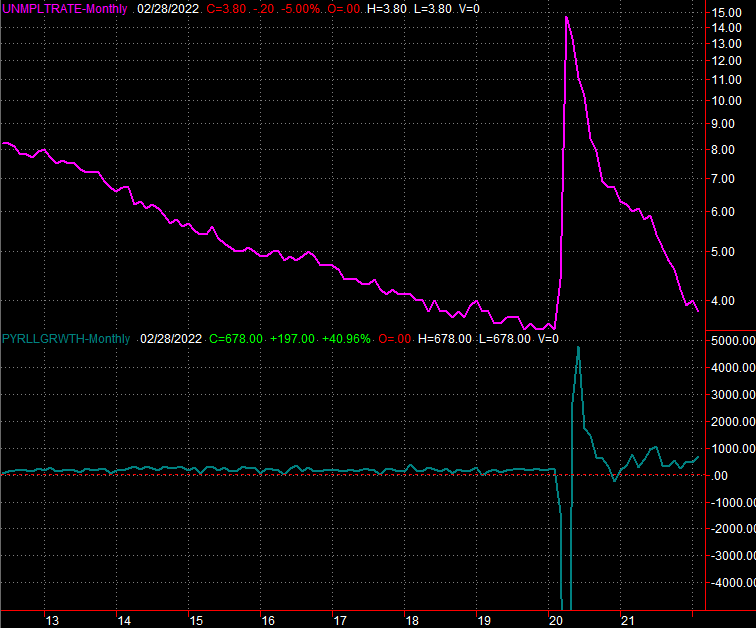
Last week was a seemingly busy one in terms of economic reports, but there really only two data sets we were really interested in. But, one of them was a doozy. That's the jobs report for last month. The addition of 678,000 new jobs ratcheted the unemployment rate down from 4.0% to 3.8%, topping economists estimates for 3.9%. Those same economists were only calling for payroll growth of 400,000.
Unemployment Rate and Payroll Growth Charts
 [1]
[1]
Source: Bureau of Labor Statistics, TradeStation
It's difficult to describe last month's jobs report as anything else but solid.
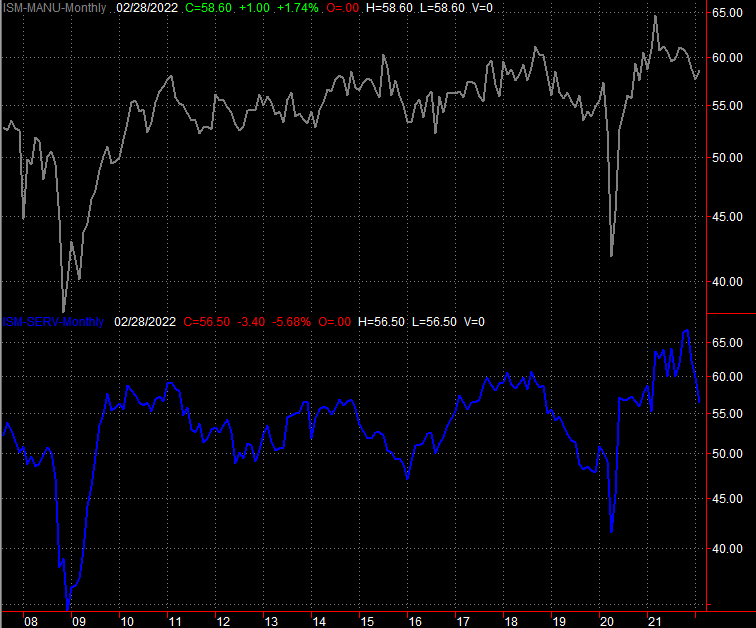
The only other information of interest last week was February's figures from the Institute of Supply Management. The manufacturing index ticked higher, from 57.6 to 58.6, surpassing expectations of 58.0. The services index, however, slipped from 59.9 to 56.5, versus expectations for a move higher to 61.0.
ISM Services and Manufacturing Index Charts
 [2]
[2]
Source: Institute of Supply Management, TradeStation
The services lull is something to watch going forward, although it too is still well above the critical 50 mark that would otherwise suggest we're in contraction mode.
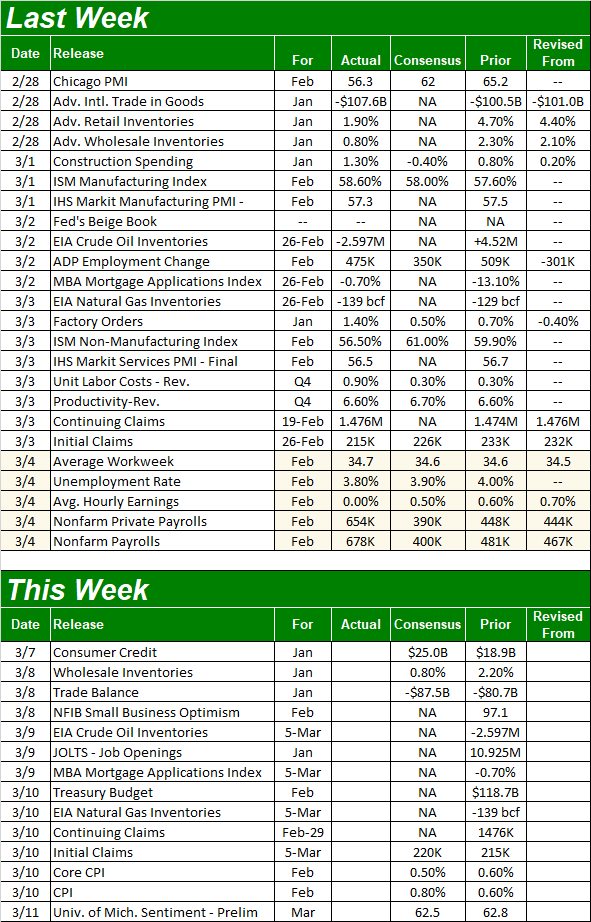
Everything else is on the grid.
Economic Calendar
 [3]
[3]
Source: Briefing.com
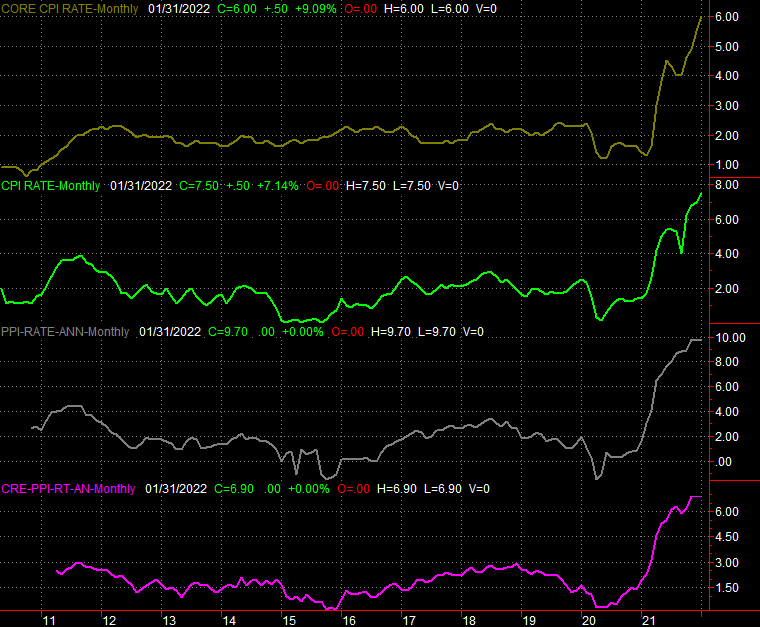
This week is light, and perhaps even lighter than the calendar would suggest. The only upcoming news we're really interested in is Thursday's look at last month's inflation, and we're only getting half the inflation picture then. That's the consumer side; producer inflation is coming next week.
As it stands right now, the annualized consumer inflation rate is 7.5%, or 6.0% not counting volatile food and energy costs. Both are expected to remain in that area this time around.
Inflation Rate Charts
 [4]
[4]
Source: Bureau of Labor Statistics, TradeStation
Producer inflation is just as frothy, as we'll see next week.
Stock Market Index Analysis
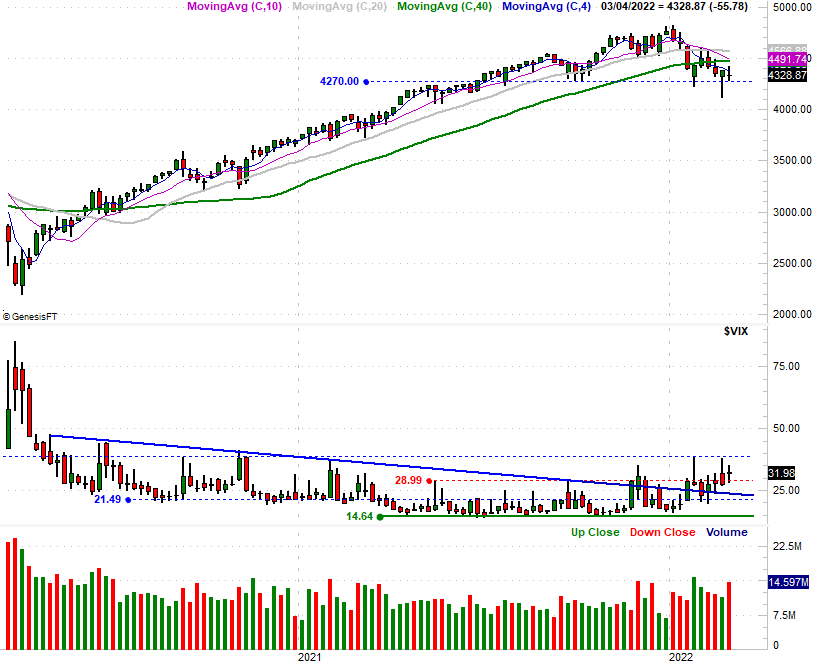
We kick this week off with a look at the weekly chart of the S&P 500 rather than a daily chart for one simple reason… you need the bigger-picture perspective to fully appreciate the details that only the daily chart can offer.
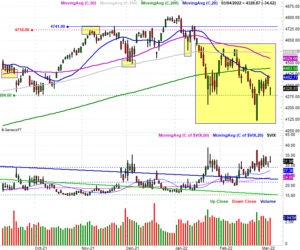
To this end, notice how last week's low tested what's becoming a pretty significant technical floor around 4270. At the same time, notice how the volatility index, or VIX seems to now be finding support around 29.0, which used to be a technical ceiling. The former is a semi-bullish clue, while the latter is a bearish clue. Even that bullish clue, however, is tainted. Last week's loss renews the downtrend that's been underway since early January, dashing hopes that the previous week's intraweek reversal effort would get some traction. That's not how things shaped up at all. Thew downtrend is still very much alive, and perhaps more so now that it's become clear the S&P 500 is stuck under all of its key moving average lines.
S&P 500 Weekly Chart, with VIX and Volume
 [5]
[5]
Source: TradeNavigator
That's no small matter, given how strong the resistance was at the first of these moving average lines the index tested last week. That's the 20-day moving average line (blue) at 4402.8. All it took was a kiss of that ceiling on Thursday to put traders back in a selling mood.
S&P 500 Daily Chart, with VIX and Volume
 [6]
[6]
Source: TradeNavigator
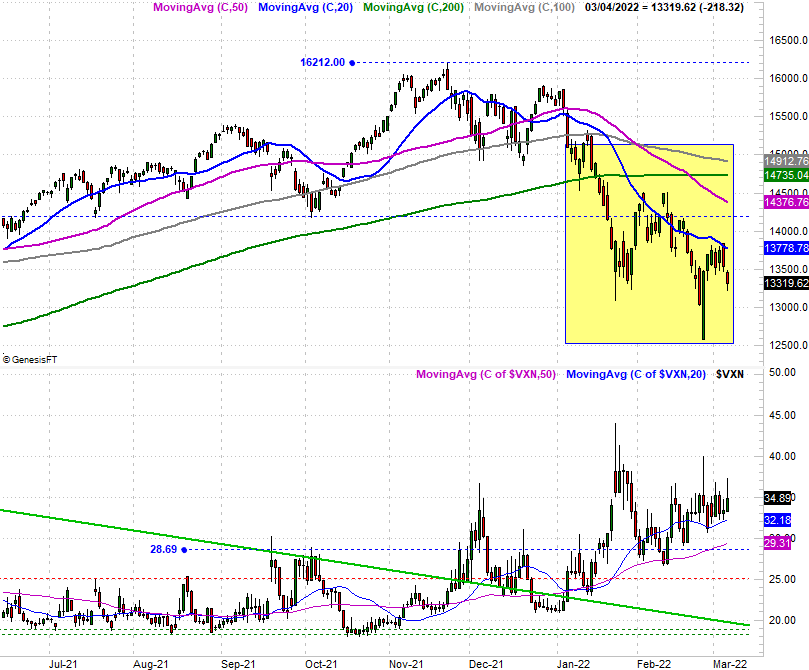
The S&P 500 wasn't the only index to bump into its 20-day moving average line. The NASDAQ Composite did the same, touching its 20-day line at 13,779 on Thursday to start what would be a pretty rough two-day rout. And, like the VIX, the NASDAQ Composite's volatility index (VXN) is also edging higher.
NASDAQ Composite Daily Chart, with VXN
 [7]
[7]
Source: TradeNavigator
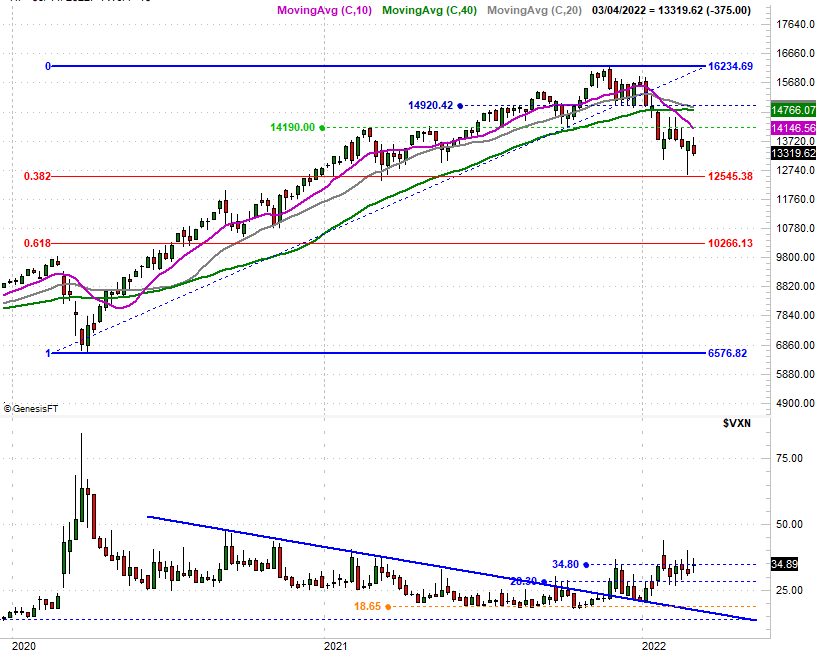
The weekly chart fleshes out things. From this vantage point the marketwide downtrend seems even better developed than it does with the S&P 500. Last week's close was below the previous week's open, for instance.
NASDAQ Composite Weekly Chart, with VXN
 [8]
[8]
Source: TradeNavigator
We mentioned this a week ago but it bears repeating now… there's a major Fibonacci retracement level at 12,545, where the composite bottomed out two weeks back. That's still a floor that's in play. That is to say, look for support there if things go south this week, but if the composite breaks below that floor, that could open the proverbial selling floodgates. At that point, the next-most-likely floor becomes the next Fibonacci retracement level at 10,266.
Yes, the market is one headline away from doing the unexpected and unlikely. Traders have to keep that in mind at all times for the time being. Stay nimble. Still, we have to assume the trend that's in motion will remain in motion until it's clear it's no longer moving in that direction. That's bearish, even if we see the occasional flash of bullish brilliance.