A slow, pre-holiday lethargic week last week. All told, the S&P 500 gained 0.2% last week, and volume was pathetic. Traders just had their mind on other things. It's not unusual to see such a lull the few days before Christmas. Things should perk up again this week, as is also usually the case, which typically sets up a bullish start to the new year.
Still, let's assume nothing. Stocks remain overbought and overvalued, and therefore remain ripe for a weakness. The key will be breaking a support level that developed a week ago.
A picture will explain it all better than mere words can, which is how we'll flesh the matter out after running down last week's and this week's major economic news.
Economic Data
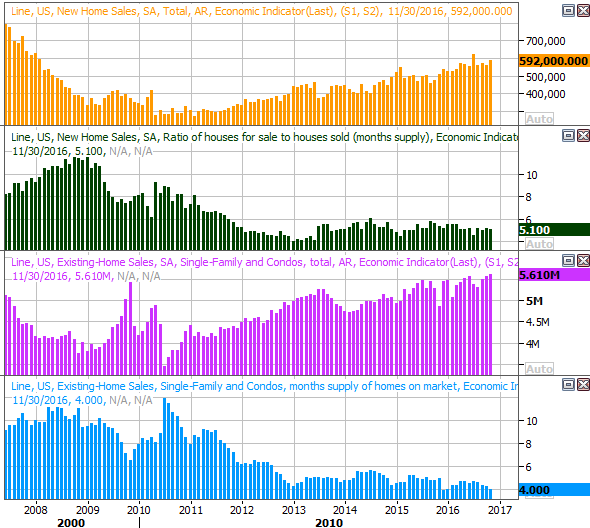
Despite last week being a slow one due the approaching holiday weekend, the economic news didn't stop flowing. It was a particularly telling week for real estate; existing-home sales as well as new-home sales were both well up, rekindling what's actually been a long-term uptrend for both.
New and Existing Home Sales, Inventory Charts
 [1]
[1]
Source: Thomson Reuters
Notice that inventory continues to dwindle, perhaps holding back what could otherwise be an even harder-driving effort. On the flipside, given that interest rates were ratcheted higher a couple of weeks ago — and a few more rate increases are in the cards for 2017 — it will be interesting to see if that puts the brakes on this trend. It shouldn't. Even a full percentage point above where we are right now, borrowing is still cheap. Perception is everything though.
The FHFA Housing Price Index also took another step forward, moving up 0.4%.
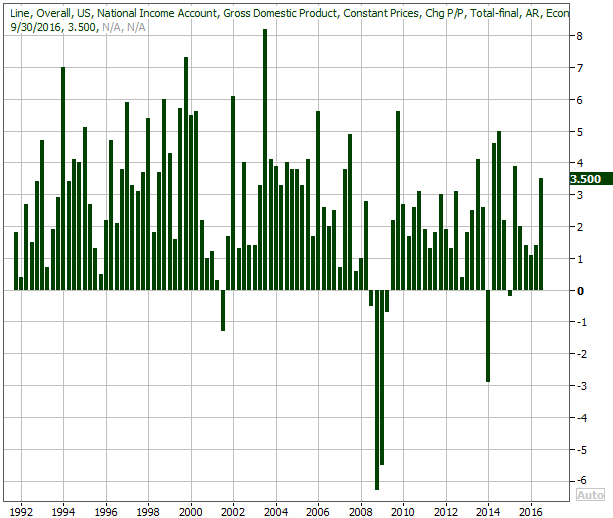
We also got the third and final Q3 GDP reading last week. It was already projected to be strong, growing 3.2% (annualized) with the second reading. It was even better than first assumed though, up 3.5%. This is an exciting prospect headed into a year that Donald Trump could really fan the bullish flames.
GDP Growth Chart
 [2]
[2]
Source: Thomson Reuters
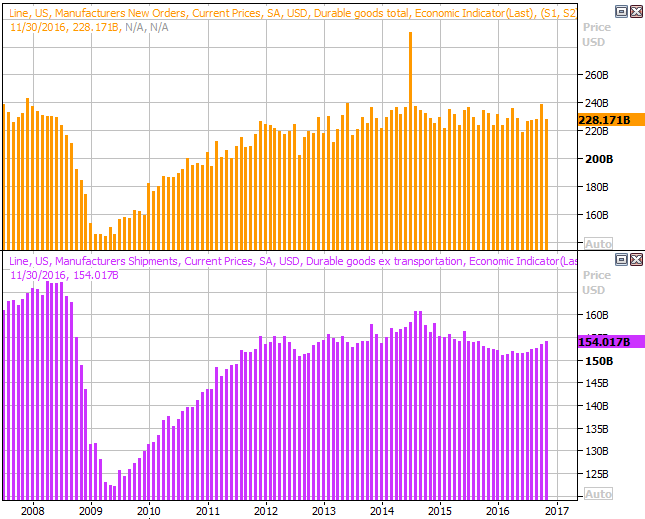
Last week's report on durable orders was a little alarming initially, but a closer look takes the edge of that worry. The 4.6% dip (a period-over-period comparison) was only driven by a big dip in transportation orders, but transportation orders are always volatile. Stripping out that part of the tally, orders were actually up 0.5% last month. The long-term chart of the raw spending (in dollars) tells the tale much better than just one month's report. Things are ok here, even though the headlines don't make that clear.
Durable Orders Chart (in U.S. dollars)
 [3]
[3]
Source: Thomson Reuters
Everything else is on the grid.
Economic Calendar
 [4]
[4]
Source: Briefing.com
This week's economic dance card is pretty thin, which is good, since a lot of people won't be watching very closely to the holiday bookends. There are a couple of noteworthy items on the way though.
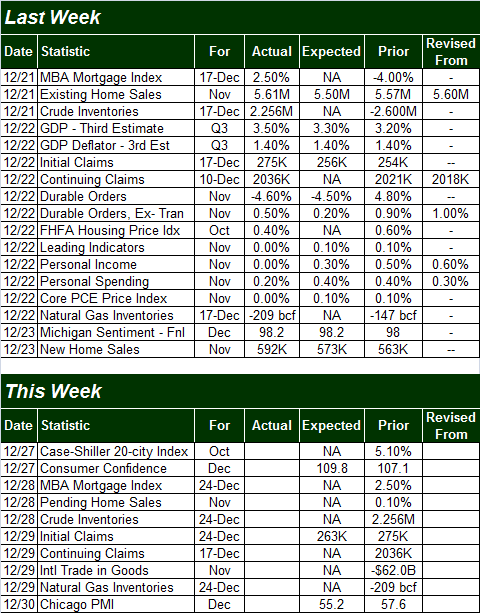
One of those is November's consumer confidence score, due on Tuesday. Economists expect another improvement in the Conference Board's measure, following last week's move to multi-year high levels. This is huge, in that confident consumers become considerable spenders.
Consumer Sentiment Charts
 [5]
[5]
Source: Thomson Reuters
Also keep any eye out for the Case-Shiller Index, the MBA Mortgage Index, and pending home sales. They'll all help round out last week's real estate picture.
Index Analysis
At first glance, last week's sideways movement appears as if it could be the beginning of a rollover…. the apex that materializes as we transition from a rally to a pullback. Be careful about blindly coming to this conclusion following last week's action, however. The market was mostly sideways over the course of the past few days because many traders (professional and amateur alike) took the week off, and weren't around to push stocks higher or lower.
That's not to say the market can't slide lower from here. It's just to see it's hardly a foregone conclusion. Indeed, most of the time, the week between Christmas and New Year's Day is a bullish one.
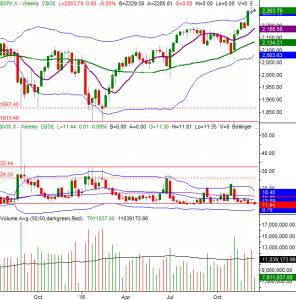
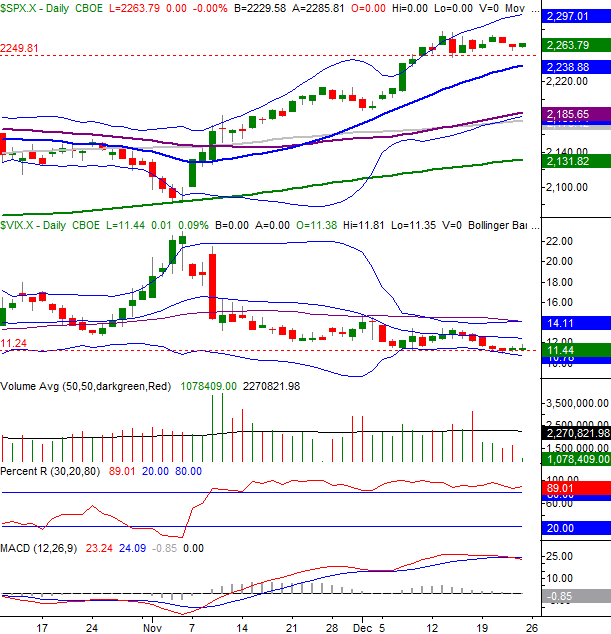
With that as the backdrop, take a look at the daily chart of the S&P 500. Clearly the market was stuck in a horizontal rut again, as was the VIX. You can also see how modest last week's volume was, and that the PercentR line remains above 80.
S&P 500 Daily Chart
 [6]
[6]
Chart created with TradeStation
The good news is, a support level has developed at 2250, and the 20-day moving average line (blue) is about to intercept that floor to lend a helping hand as support. The bad news is, the market is well overbought, and we technically saw a bearish MACD divergence take shape as of Friday. Between that overextension and the fact that the VIX is at a well-developed floor, there doesn't seem to be much — if any — room for a whole lot more upside. This is especially evident on the weekly chart of the S&P 500.
S&P 500 Weekly Chart
 [7]
[7]
Chart created with TradeStation
It's the weekly chart, though, that waves a subtle red flag.
Take a closer look at the last two bars on the weekly chart. In both cases the market tried to forge ahead (via a effort to make a higher high), but in both cases the buyers couldn't hang on to their gains. In both cases the S&P 500 closed in the lower half of the weekly range. More than that, it effectively closed where it opened in both cases, forming a doji… a hint of a reversal. Perhaps last week's staleness was holiday-related. Two weeks in a row though? And, after a seven-week, 8.5% rally that carried the S&P 500 above its upper 26-week Bollinger band for the first time in years? It's asking a lot of the bulls to tack on more gains, even if it is Santa Claus rally time.
Whatever's in the cards, the trend is your friend until it isn't. The market won't be "in trouble" until the S&P 500 breaks under 2250, and even then there's a huge swath of support waiting to step up to the plate at 2185. In the meantime, we're at a bullish time of year… a bullishness that tends to last for a few days into the new year.
Keep everything on a short leash for the next two weeks. The whole thing is fragile. Certainty is at a minimum.