
For the better part of the holiday-shortened week stocks were bounding back from the prior week’s setback. When push came to shove for the bulls though, the bulls flinched. Friday’s setback suspiciously started near well-established technical resistance, at least partially pushing the market back to the brink.
But not beyond it. The sellers stopped just short of dragging the market below important technical support, leaving things very much on the fence.
We’ll take a detailed look at this delicate balancing act in a moment below. First though, let’s run through the small bit of economic news reported last week.
Economic Data Analysis
The party started bright and early on Monday morning, with December’s report of consumer confidence from the Conference Board. Although it’s not yet updated on our chart below, rather than ticking slightly higher from November’s print of 112.8, it fell quite a bit to 104.7.
Consumer Sentiment Charts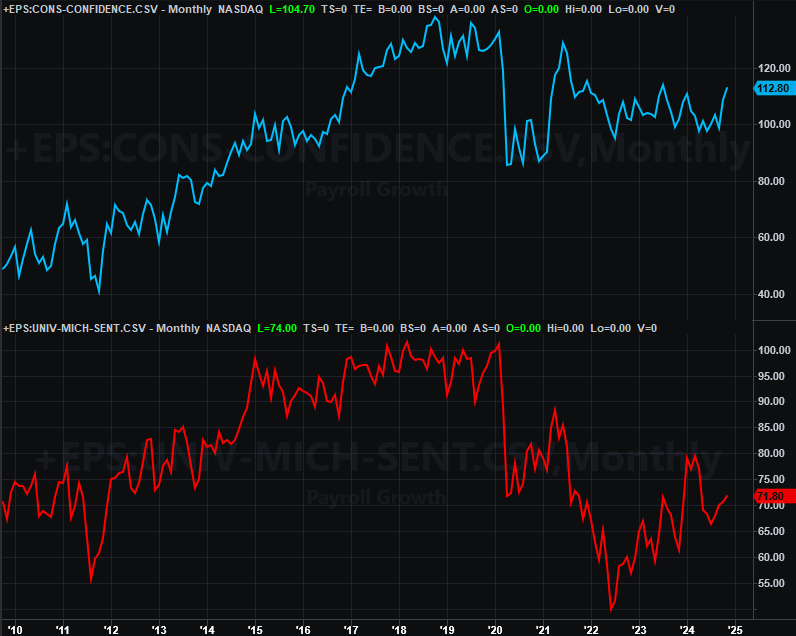
Source: University of Michigan, Conference Board, TradeStation
This is in contrast with the University of Michigan’s consumer sentiment index, which actually improved from 71.8 last month to 74.0 this month. In the bigger-picture sense, however, both consumer sentiment readings are on the fence, so to speak, regardless of December’s modest moves in opposite directions.
The only other item of interest last week was November’s new home sales data from the Census Bureau, rounding out the NAR’s recent update of existing home sales. New-home sales ticked higher as expected, but at an annualized pace of 664,000 fell just a bit short of guesstimates. Either way, although home sales seems to be generally improving, they’re still relatively low.
New, Existing Home Sales Chart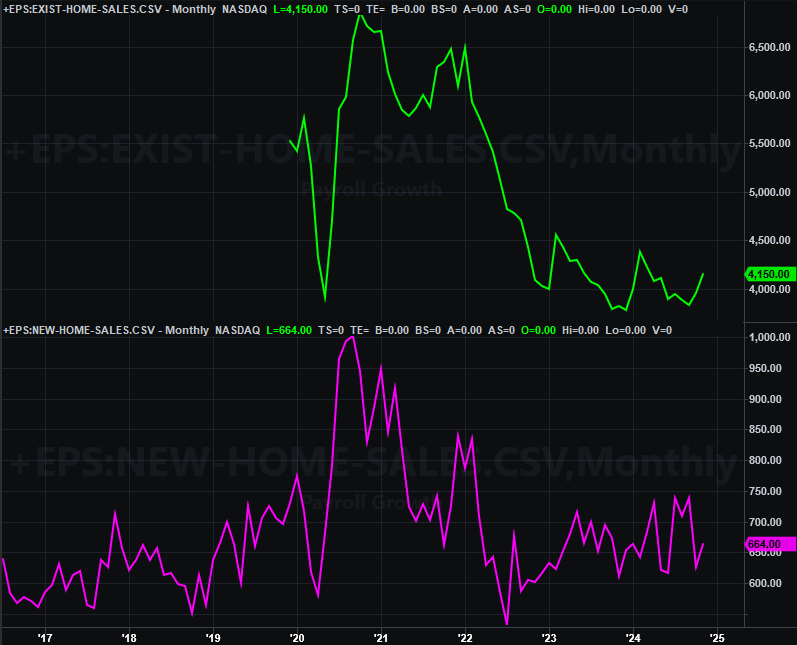
Source: Census Bureau, National Assn. of Realtors, TradeStation
Everything else is on the grid.
Economic Calendar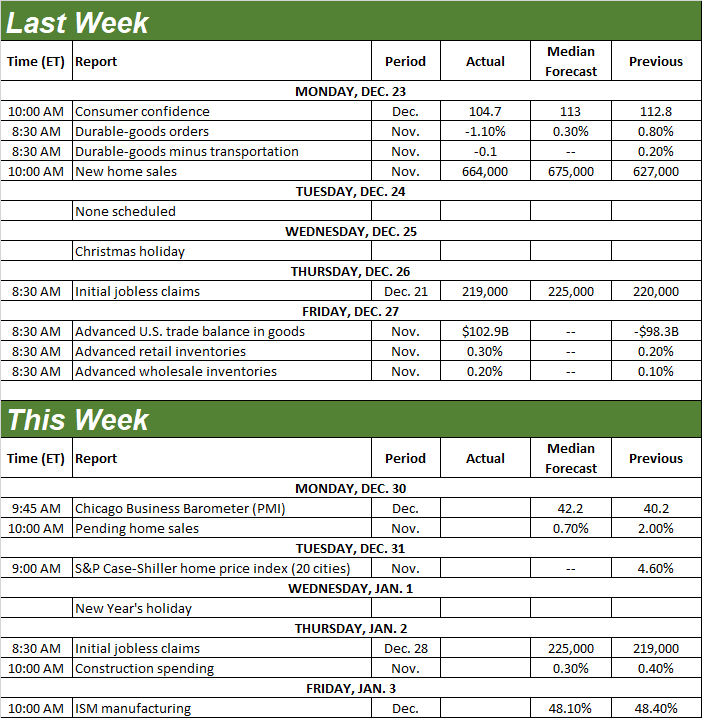
Source: Briefing.com
The real estate picture will be rounded out this week… on Tuesday, when we’ll hear October’s home price data from Case-Shiller and Standard & Poor’s as well as the FHFA’s home price data. Both are at elevated levels, although the Case-Shiller Index is clearly losing ground now. It’s not clear what to expect this time around. Just bear in mind that these numbers only reflect prices at which homes are being sold. They don’t indicate how many are being sold (although it stands to reason that at least some of this frothy pricing is the result of limited supply and decent demand).
Home Price Charts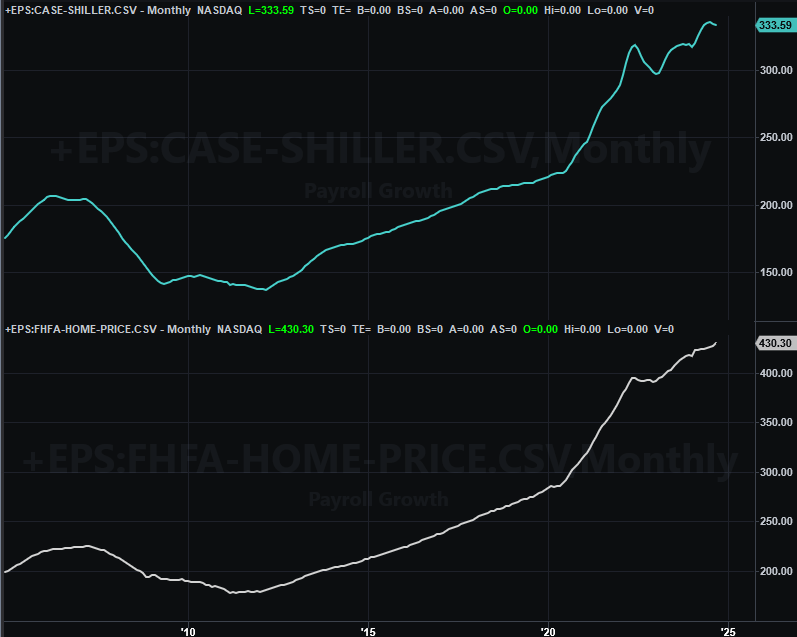
Source: Standard & Poor’s, Case-Shiller, FHFA, TradeStation
We’ll also get some data from the Institute of Supply Management this week. The ISM Manufacturing Index for December is due on Friday. It’s more or less expected to roll in near November’s levels, which is just below the pivotal 50 level.
ISM Manufacturing, Service Index Charts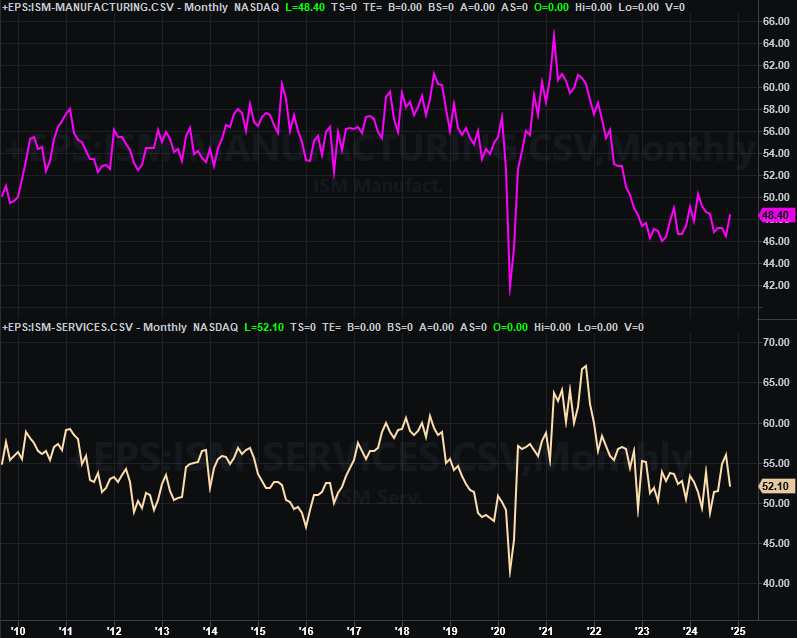
Source: Institute of Supply Management, TradeStation
As the image above reminds us, the ISM’s service index is holding above the 50 mark despite last month’s sizeable stumble. Either way, neither of these data sets is overwhelmingly bullish in their current condition.
Stock Market Index Analysis
The already-vulnerable market proved it was vulnerable again last week, with the rebound effort ultimately giving way before it could get going in earnest. By Friday’s close, the NASDAQ Composite’s weekly gain of 1.5% was pared back to only about half of that.
Even so, the late pullback wasn’t big enough to drag the composite below the rising technical support line that connects all the key lows since August (yellow, dashed, on the daily chart of the NASDAQ below). As long as the composite holds above this level, the rally is still technically intact.
NASDAQ Composite Daily Chart, with VXN and Volume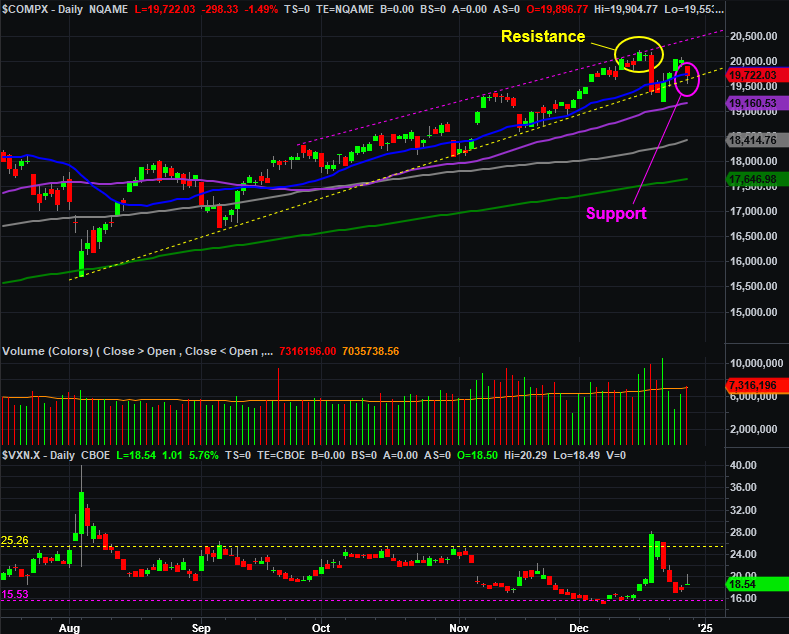
Source: TradeNavigator
Zooming out to a weekly chart of the composite adds some important detail to the current situation. Namely, although the NASDAQ may be testing a near-term floor at this time, there’s still a thick band of technical support below. That band extends all the way down to 17,120. Any of these lines could stop the bleeding — so to speak — should the composite break under the current floor.
NASDAQ Composite Weekly Chart, with VIX and MACD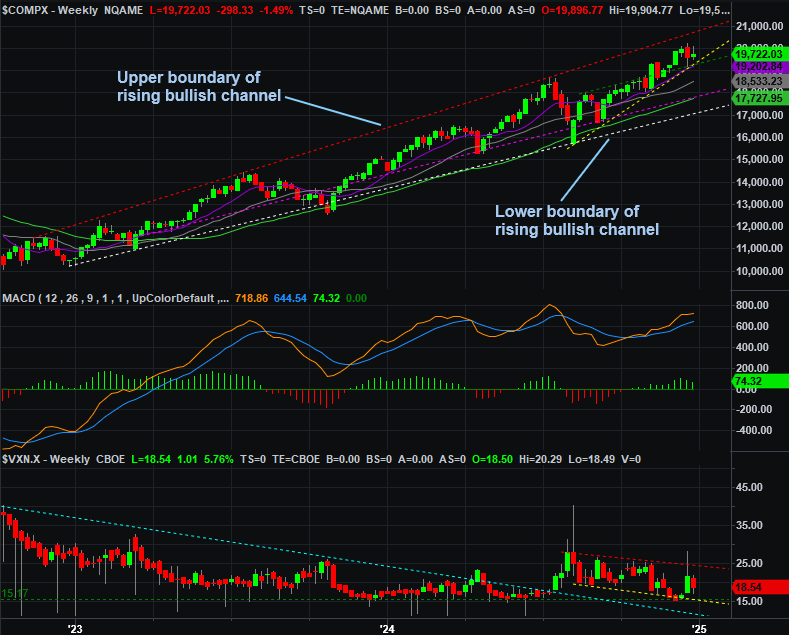
Source: TradeNavigator
The S&P 500’s situation is similar, although not quite identical. It appears to be finding technical support at its 50-day moving average line (purple) at 5,945 after briefly pulling under it on Friday before fighting its way back above it. As the daily chart below illustrates, the 50-day average has successfully stopped and reversed multiple pullbacks since May (circled in light blue).
S&P 500 Daily Chart, with VIX and Volume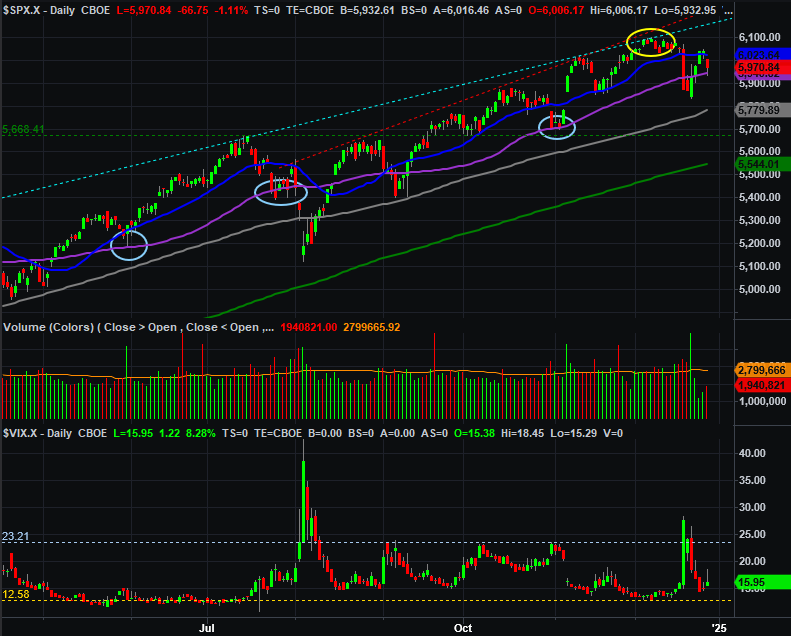
Source: TradeNavigator
The weekly chart highlights the fact that the S&P 500 is still nearer the upper portion of a long-standing (and rising) trading range than the lower side, leaving room for further downside that wouldn’t necessarily end the bigger-picture bull market. That lower boundary currently stands right around 5.660, but is rising fast.
S&P 500 Weekly Chart, with VIX and MACD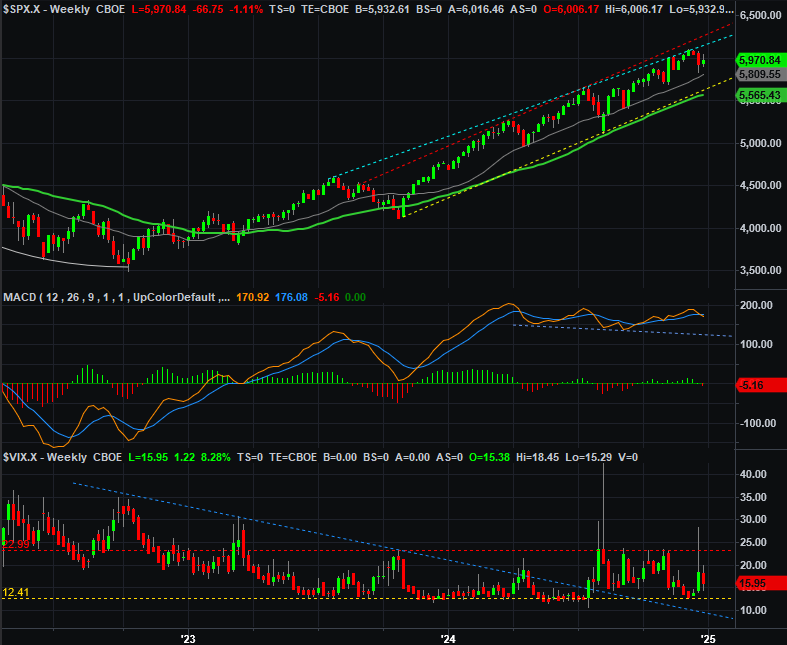
Source: TradeNavigator
So what’s the call here? First and foremost take everything with a grain of salt. Not only did the Christmas holiday break remove one and a half days’ worth of trading out of last week’s action, many traders simply didn’t show up for much — if any — of last week’s trading. This isn’t necessarily a majority opinion…. to the extend any opinion can be discerned (which isn’t much).
On balance though, while we fully acknowledge the bulls held the line with some help from predictable technical support levels, the overall market remains overbought and overvalued. Not only is at least a small correction the higher-odds outcome from here, but it might actually be the healthiest move in the long run.
The tricky part remains the time of year. This is usually a bullish week, leading into a bullish first few days of a new year. Traders are likely to try and make that happen again this time around, just by force of habit. Once that dust settles though, we’re still left with overbought, overvalued stocks that really could use a corrective move.
That’s the long way of saying even if stocks do manage to keep climbing rather than correcting, it’s unlikely either of the indexes discussed above will be able to push past the upper boundaries of their current bullish trading ranges.