
The market didn't start last week on a bullish foot, but it didn't take more than a few hours for the bulls to get back at it and drive stocks to record highs. On the flipside, they finished the week on a sour note despite starting Friday with a bullish bang.
What does it mean? Maybe not much. Geopolitical tensions are in play at the same time investors are trying to determine if an economic headwind is brewing. Never even mind the fact that the market is technically overbought, and by some measures, more overvalued than it's ever been. (The S&P 500's price-to-sales ratio, for the record.) Yet, the bigger-picture momentum still seems poised to push stocks upward.
We'll weigh the odds of that happening in a moment. First, let's look at last week's big economic announcements and preview this week's releases. That includes a look at December's jobs report, which inspired mixed reactions from the experts.
Economic Data Analysis
Last week was fairly busy in terms of announcements, though not many of them were particularly hard hitting. Of the hard hitting stuff though, the undertones were bullish.
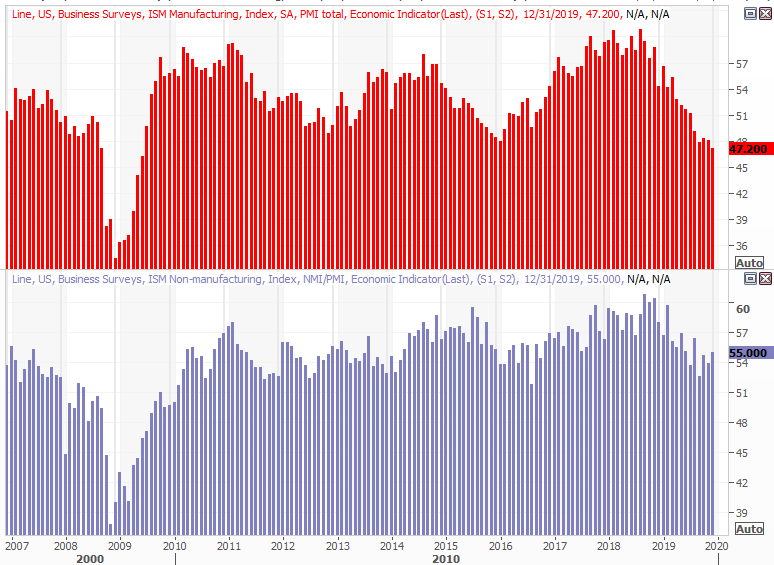
For instance, the ISM Services Index improved, and by more than expected. It grew from 53.9 to 55.0, firming up the upside reversal that started to take shape three months ago. It also eased some of the concern that's started to take shape with the ISM Manufacturing Index, which has been sliding lower for several months now.
ISM Index Charts
 [1]
[1]
Source: Thomson Reuters Eikon
Interestingly, services jobs saw measurable growth last month, while manufacturing jobs dwindled; the jobs market and the ISM numbers are telling the same story.
On that note, December's jobs report was better than most of the media was making it out to be. The economy added 145,000 new payrolls, and while that was well below November's tally and fell short of expectations, the holdup remains a lack of qualified and willing workers. Some would argue that slowing wage growth suggests there's not a real supply/demand imbalance, bear in mind that wage growth is being compared to the unusually strong wages being normalized a year ago. The bulk of the pay raises are also going to lower-income workers who can do more with that additional income.
Unemployment Rate, Payroll Growth Charts
 [2]
[2]
Source: Thomson Reuters Eikon
The unemployment rate didn't budge from a multi-decade low near 3.5% either, while the most recent JOLTS (job openings) survey says we're still seeing a near-record number of job openings — back up to 7.3 million as of October — that just can't be filled.
We explored the proverbial "rest of the story" about last month's employment numbers at the website: https://www.bigtrends.com/stocks/december-jobs-report-was-just-fine-dont-sweat-the-pessimism/
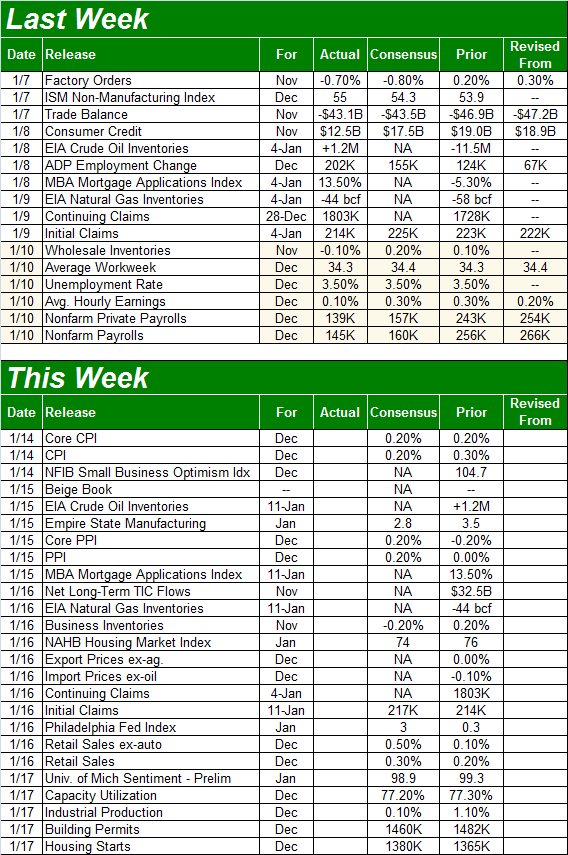
Everything else is on the grid.
Economic Calendar
 [3]
[3]
Source: Briefing.com
This week is a big one. That party starts on Tuesday with a look at last month's consumer inflation, followed by producer inflation figures on Wednesday. Economists think it was pretty tame across the board, calling for a month-to-month 0.2% increase by all measures. The annualized inflation rate now stands at 2.0%. It's more or less on the rise, but not in an unhealthy way.
Consumer, Producer Inflation Charts
 [4]
[4]
Source: Thomson Reuters Eikon
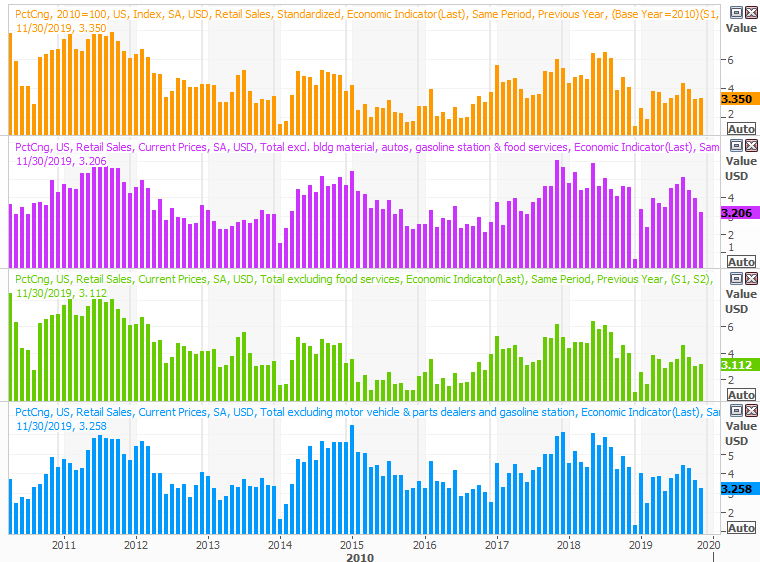
Last month's retail sales figures will be posted on Thursday. We need a strong showing for the all-important month of consumerism, and the pros say we'll get it. Retail trade groups also say the holiday shopping season was a robust one.
Retail Sales Growth Charts
 [5]
[5]
Source: Thomson Reuters Eikon
Look for last month's capacity utilization and industrial productivity figures on Friday, and don't underestimate the importance of those numbers. They reflect the ultimate strength of the economy. Both has been trending lower for a while, which is what makes November's bump so exciting. Economists aren't looking for much change, which could prove to be very good or very bad for this overextended market.
Industrial Productivity, Capacity Utilization Charts
 [6]
[6]
Source: Thomson Reuters Eikon
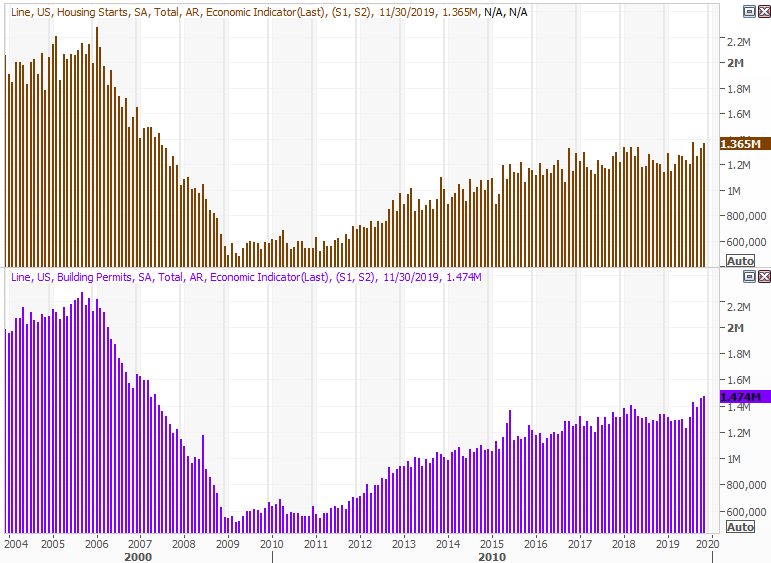
Finally, also on Friday we'll get our first look at how the real estate market fared in December, with housing starts and building permits. Both have been decidedly strong in recent months, and economists are looking for more of the same for last month.
Housing Starts, Building Permits Charts
 [7]
[7]
Source: Thomson Reuters Eikon
Stock Market Index Analysis
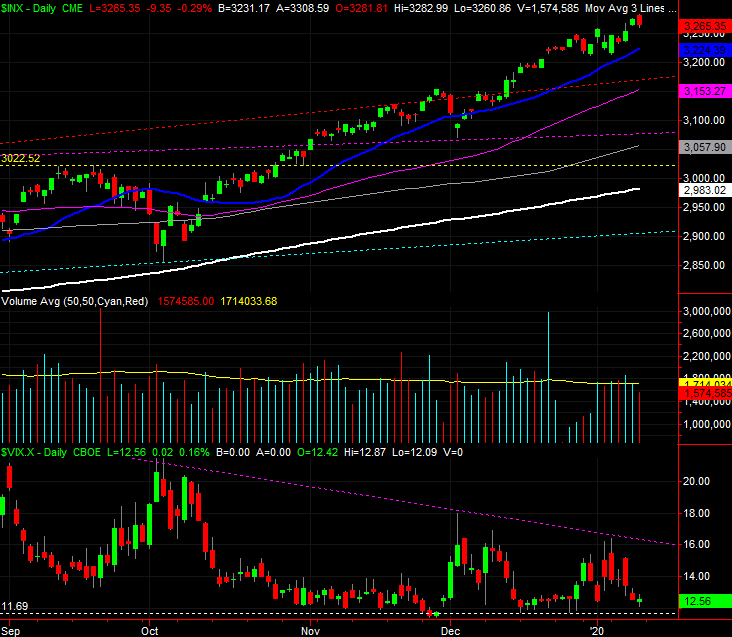
The week was a winner — a big one — right up until it ended. On Friday though, the bulls changed their mind mid-day headed into the weekend. That's when you most want to see optimism… when investors will be forced to hold stocks for a two-day stretch during which they can't get out of them. Also notice that even during last week's three winning days, the volume behind those gains was modest.
S&P 500 Daily Chart, with VIX and Volume
 [8]
[8]
Source: TradeStation
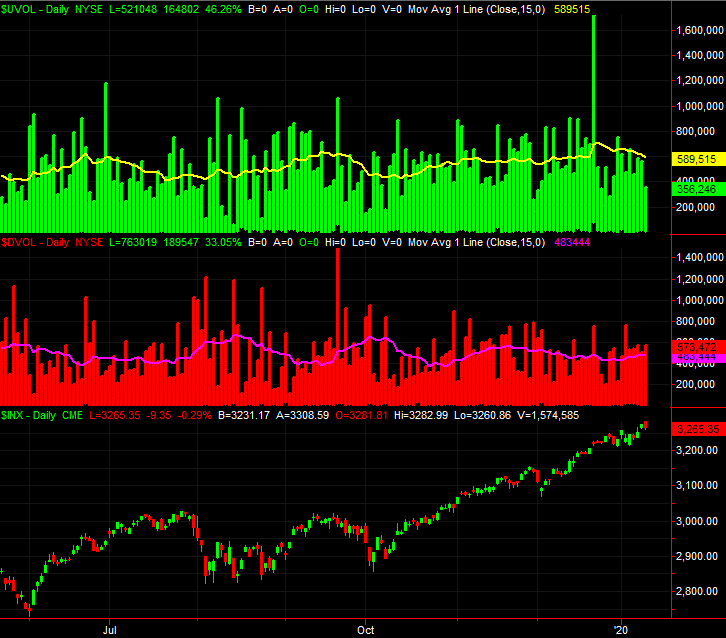
And don't dismiss the volume trend. Not only was there a lack of volume with last week's "up" days, the daily level of bullish volume (UVOL) has been shrinking since the end of last year. Meanwhile, the amount of daily bearish (DVOL) volume has been growing.
S&P 500 Daily Chart, with NYSE Up, Down Volume
 [9]
[9]
Source: TradeStation
That can't come as a total surprise, for a couple of different reasons.
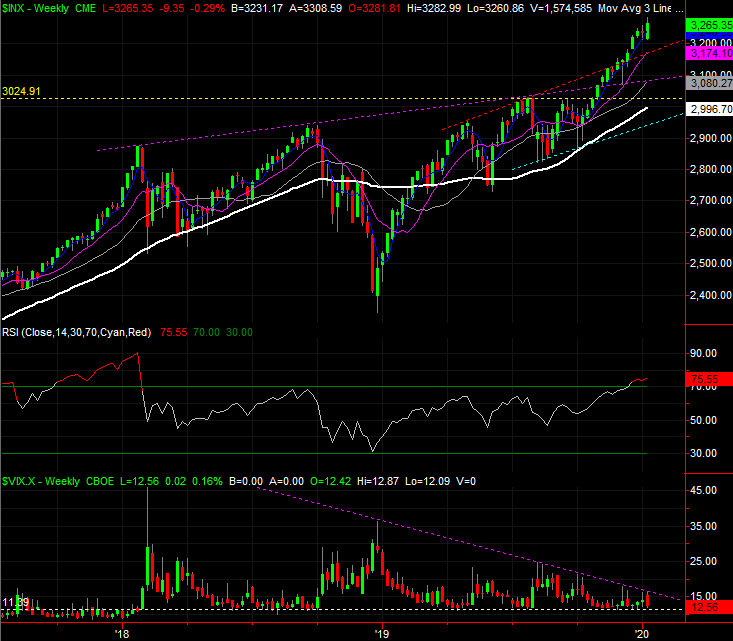
One of those reasons is, the S&P 500 has now rallied nearly 14% from its early October lows. That leaves it overextended in the near term regardless of the context behind it. (It's even more overbought given how far it rallied during the first three quarters of last year. The weekly chart of the S&P 500 has pushed its RSI indicator into overbought territory for a couple of weeks now, and more so than it had since the very beginning of 2018.
S&P 500 Weekly Chart, with VIX and RSI
 [10]
[10]
Source: TradeStation
The other reason is, the VIX is not only back at uncomfortably low levels, but appears to be now trapped in the tip of a converged wedge pattern that will force the bulls and/or the bears to make a commitment. With stocks — by some measures — more overvalued than they've ever been, the bear case is bolstered. That's not necessarily a call for a bear market, but a setup for a sizeable correction.
The same basic story for the NASDAQ… that is, the momentum seems healthy, but the persistence of the momentum since early October has left the index overbought and overextended. Also notice that the span of the advance since early October is more or less about the same pace and distance as the rally that started to take shape beginning in late 2018. That move wasn't the bull market's last hurrah, but it did set up a reasonably painful pullback. And, like the S&P 500's VIX, the NASDAQ Composite's Volatility Index, the VXN, has also been pushed into the tip of a converging wedge pattern. The upper boundary is marked as a purple, dashed line. Breaking above that level could also mark the beginning of an overdue correction.
NASDAQ Composite Weekly Chart, with VXN and RSI
 [11]
[11]
Source: TradeStation
Still, the momentum is bullish. It would take a move below the 20-day moving average lines (marked in blue) to even start entertaining the prospect that the correction is finally upon us.