
If you're confused and unsure of what lies immediately ahead for the market, don't beat yourself up. That's by design, and you're not alone. In fact, stocks seemingly deliberately ended the trading week on the fence, leaving most traders struggling to even guess what may be in store for the week. All the key indices are trapped squarely between support and resistance.
Do know that the odds and the calendar are both working against the overall market though.
We'll explore how the bears' poor pacing was their biggest problem last week, setting the stage for a rebound. Conversely, we'll also explore how the bulls' biggest problem was also their pacing, and lack of genuine buying interest. Before we wade into any of that analysis though, let's review last week's economic news and preview this week's economic announcements.
Economic Data Analysis
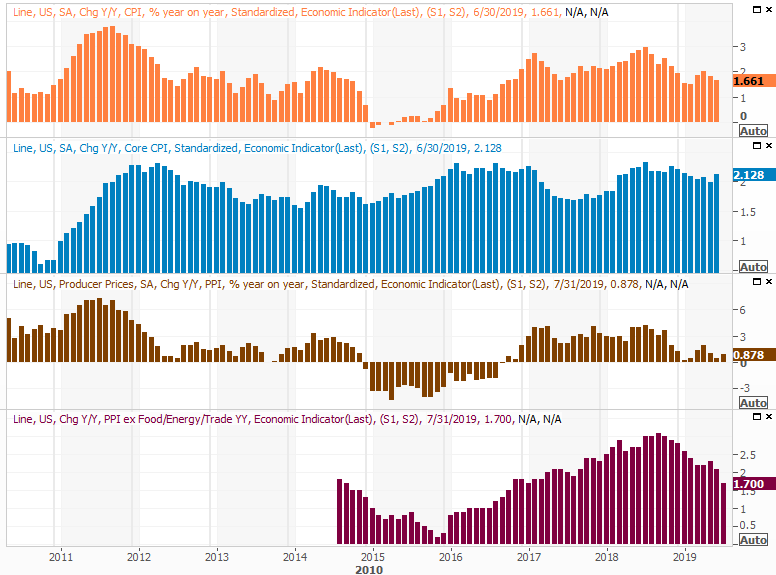
It was a light week last week in terms of economic news, but the one big item we got was a jaw-dropper. Producer inflation (at least on a 'core' basis that excludes the price of food and energy) fell 0.1% from June's levels. Counting food and energy, prices grew 0.2% month to month, though that still translates into the lowest annualized inflation rates seen since 2016, when it was on the way up. Overall inflation for factories and production facilities remains nil.
Producer, Consumer Inflation Charts
 [1]
[1]
Source: Thomson Reuters
Last month's consumer inflation numbers won't be posted until this week, but if the producer inflation figures are any indication, economists may have overestimated how much pricing power consumer companies actually have here. 'The' inflation rate now stands at 1.66%, and pros are thinking consumers are paying a little more than they were in June. That is, they've predicted a measurable (though still moderated) price-hike for July. That may not be what's in the cards now, though, the earlier look at producer inflation.
Whatever the case, the questionable decision to lower interest rates last month no longer looks questionable. It looks like a stroke of brilliance. We could actually use some inflationary pressure here, and lower rates could stoke. Now, Jerome Powell's cautionary thoughts about a rate-hike feel a little misguided.
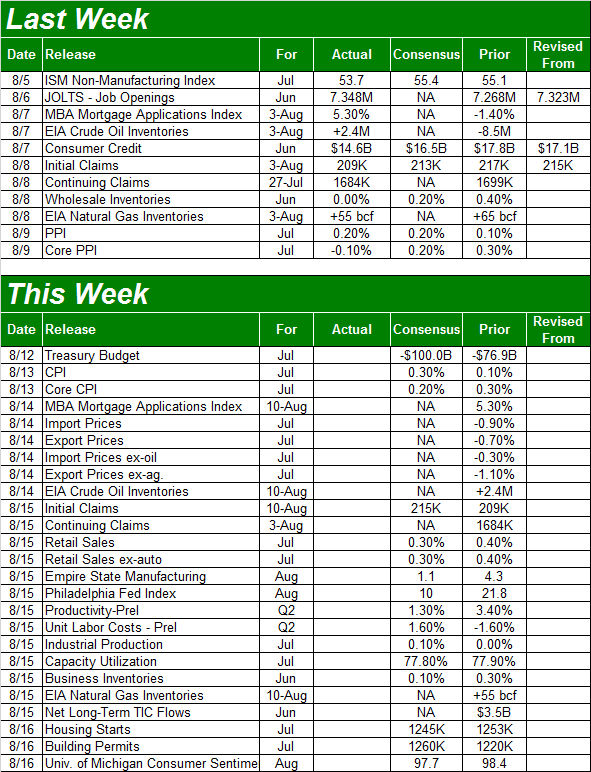
The consumer inflation report will be posted on Tuesday. Everything else is on the grid.
Economic Calendar
 [2]
[2]
Source: Briefing.com
Tuesday's consumer inflation report is the first biggie of the week, but hardly the only biggie. On Thursday we'll hear about July's retail spending, which is closely tied into inflation data.
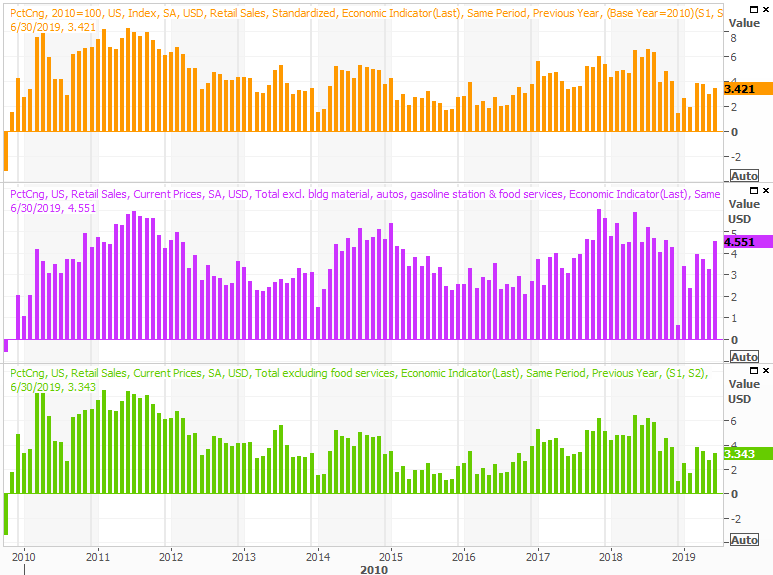
You'll recall that spending growth slowed earlier in the year. Though the slowdown was so dramatic is was questionable (and has since been revised upward, albeit modestly), the crux of that slowdown may have had more to do with being compared to incredible growth rates over the course of 2018. Whatever the case, June's consumer spending grew impressively well, and economists are looking for another strong month.
Retail Spending Growth Charts
 [3]
[3]
Source: Thomson Reuters
It may well be that consumers, most of whom are enjoying bigger paychecks, are taking advantage lower prices. There's little doubt they're doing their part to keep the economy growing.
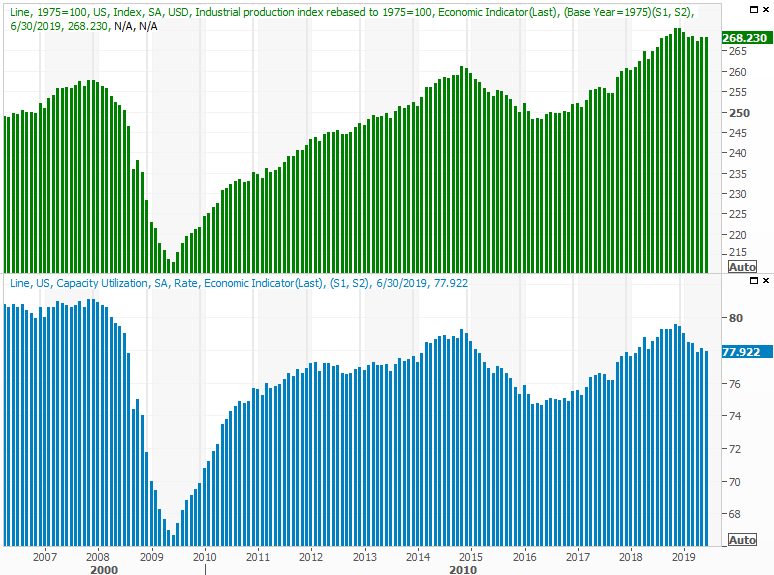
On Thursday we'll get what's arguably the most important data set long-term investors should care about. That's last month's industrial productivity and capacity utilization data, which closely coincides with corporate earnings and the market's broad direction.
Both soared last year, only to peak early this year – most likely reflecting the impact of a tariff war. But, each measure seems to be stabilizing, perhaps as a precursor to renewed growth. Analysts aren't looking for growth, or a contraction. They're just looking for July's numbers to look more or less like June's. That's why any variance from that outlook could be market-moving.
Industrial Productivity, Capacity Utilization Charts
 [4]
[4]
Source: Thomson Reuters
Finally, on Friday, we'll wrap up our look at the real estate market by digesting July's housing starts and building permits data.
You already know home prices are still rising, though at a slower pace. You also know that home purchases are flattening, while starts and permits have leveled off as well. Economists don't think that changed much in July.
Housing Starts and Building Permits Charts
 [5]
[5]
Source: Thomson Reuters
Again, any variance from expectations here has the potential to move stocks.
Stock Market Index Analysis
In the 1990 blockbuster movie The Hunt for Red October, the captain of the Russian submarine named Marko Ramius (played by Sean Connery) was known for executing an unusual maneuver called a 'Crazy Ivan.' In simplest terms, it was a sharp turn, to the left or to the right, to make sure an unknown sub wasn't following the Red October by hiding in the wake of its motion. They were called Crazy Ivan's because they were a little bit dangerous, and seemingly random. They accomplished their purpose though, by keeping any enemy submarine captains from sneaking up on his vessel. It kept the enemy 'honest' with unpredictability.
What happened over the course of the past couple of weeks to the market was a Crazy Ivan. That is, just when most traders felt the market was on firm footing and that they had it all figured out, stocks reminded traders they can't assume anything. The big disruption was a not-so-gentle reminder that nobody can afford to become complacent. The market will punish it, sooner or later.
And that's not just an arbitrary idea.
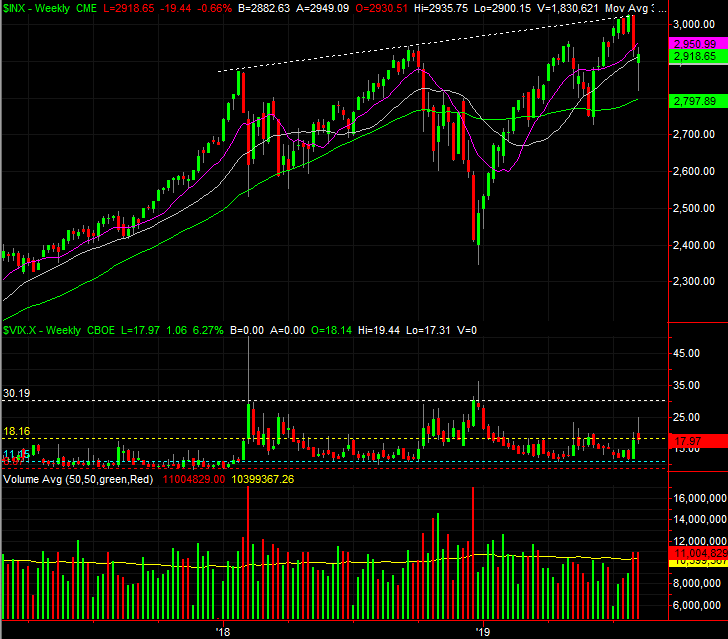
Take a look at the weekly chart of the S&P 500 below. Specifically, take note of how the VIX had fallen back to a multi-month low near 11.1 (marked with a light blue line), suggesting a widespread level of confidence and bullishness. Though it can take several weeks to tip it over, it's rare that the broad market escapes a serious setback once the VIX finds this familiar floor.
S&P 500 Weekly Chart
 [6]
[6]
Source: TradeStation
The weekly chart also shows us something else that's alarming… as much as stocks feel like they fell from high to low in just two weeks' time, they didn't actually slide dramatically lower.
From peak to trough, the S&P 500 only traveled about 6.8% before bouncing back. That's enough to set the stage for a dead-cat bounce – which we've seen – but it's not necessarily enough to call a true, complete capitulation. In the same vein, notice that while the VIX spiked, it didn't reach the 30-ish level that was hit the last couple of times the S&P 500 made a major, trade-worthy bottom.
You'll also see the S&P 500 didn't even touch its 200-day moving average line, plotted in green, which has more often than not been a bare minimum for major lows of late. In fact…
Speaking of moving average lines, the S&P 500 hasn't just thrown traders a curveball by not at least kissing the 200-day moving average line with the recent lull. As of Friday's slight (relatively) dip, the index is dealing with resistance at its 50-day moving average line (purple), and finding support at its 100-day moving average line (gray). This is a clue that traders are completely unclear as to what's next for the market, so they're content to simply park and wait, on the fence.
S&P 500 Daily Chart, with VIX, Volume
 [7]
[7]
Source: TradeStation
In short, this is the market's subconscious way of trying to lure you into a mistake by making a bet in the wrong direction. Those who flinch first, or act out of fear (including the fear of missing out) tend to end up regretting their thinking.
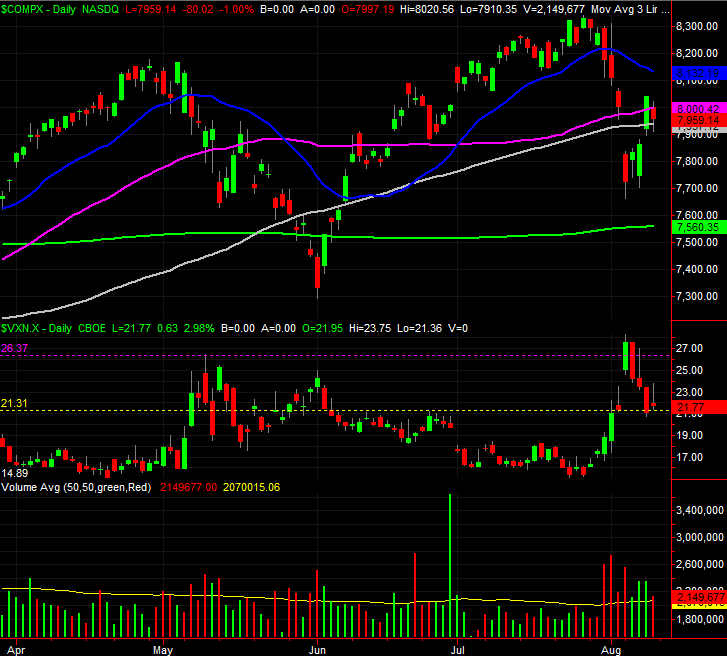
And for the record, the NASDAQ Composite's chart is in the exact same pickle. It's not evident on the daily chart, but the NASDAQ Composite's Volatility Index (VXN) doesn't truly peak and the composite itself doesn't truly bottom until the VXN reaches the 35-ish area.
NASDAQ Composite Daily Chart, with VXN, Volume
 [8]
[8]
Source: TradeStation
This is a tricky situation for traders, though it doesn't have to be. Indeed, the market may try and dish out a few more headfakes just to frustrate a few more traders into a mistake. Don't take the bait. It's likely, in fact, that the S&P 500 will travel between its 200-day moving average line at 2793 and the 20-day moving average line (blue) at 2969 perhaps a couple of different times before it snaps out of that narrowing range. The travel between those boundaries could be trade-worthy, though only for true swing traders. The bigger action is going to happen once outside of that range.
The direction is this week's first, or even second, move is a coin toss right now.