
Yes, stocks dished out a firmly bullish bounce on Friday. Consider the circumstances though. At one point on Thursday the S&P 500 was down as much as 3.8% for the week, and hit the 10% correction mark that day (from its mid-February high). Some sort of pushback could have been expected. Whether it persists long enough remains to be seen. We’ll simply say here there are still several humps for the bulls to get back over. We’re not hopeful… at least not yet.
In any case, we’ll look at last week’s economic news first; it is pretty important. Then we’ll preview what’s coming next week; there’s a lot of market-moving stuff in the lineup as well.
Economic Data Analysis
There was only one kind of noteworthy economic news printed last week. It just came in two batches. On Wednesday we heard last month’s consumer inflation data, followed by producer inflation figures on Thursday. In short, inflation seems to be cooling. One small monthly dip hardly makes a trend, but all big trends start as small ones.
Consumer, Producer Inflation Charts
Source: Bureau of Labor Statistics, TradeStation
And this data is sure to come back into focus this week. See, as the grid below points out, the Federal Reserve’s Open Market Committee is going to publish its decision regarding interest rates on Wednesday. The general consensus had been that it couldn’t afford to cut rates quite as aggressively as it had recently planned simply because inflation was still elevated, and creeping higher. Now it may not be.
This isn’t the only data the FOMC considers when making interest rate calls. It’s not even really the primary data the Fed looks at when making the decision. That’s still personal income and expenditures, with January’s figures being posted two weeks back; February’s numbers won’t be out for a couple more weeks. Per the last report we got though, income was up (again) by even more than expected, yet spending actually fell rather than making the slowing increase economists were calling for. Now last week’s inflation figures for February make a bit more sense.
More to the point, the Fed has at least a little more room to push rates down than it did just a couple weeks back. And, given the market’s recent action, it’s also got a little more reason. To this end, the market’s saying we won’t get a rate cut this time around. And, there’s only a 28% chance we’ll see a quarter-point cut when an interest rate decision is scheduled for May.
In any case, everything else is on the grid.
Economic Data Report Calendar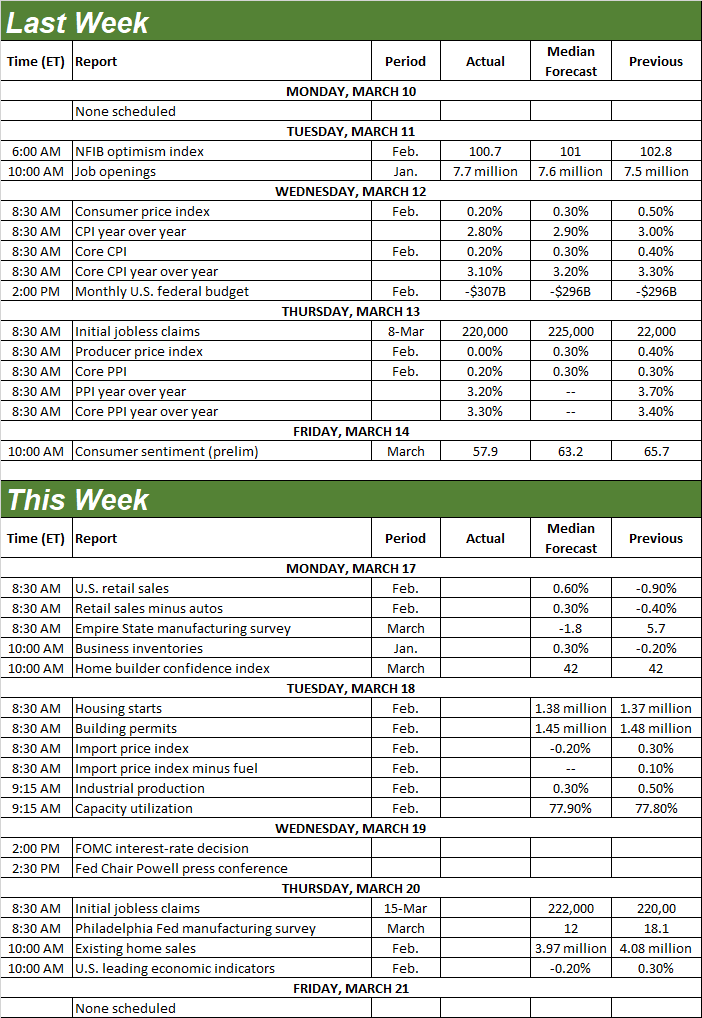
Source: Briefing.com, TradeStation
The Federal Reserve’s interest rate call will be made on Wednesday, but we’re going to get some important data before and after that.
Take Monday’s look at last month’s retail sales, for instance. After a shocking (somewhat weather-driven) lull in January should be unwound with a 0.6% increase this time around. Notice that retailing continues to make slow-but-steady bigger-picture forward progress.
Retail Sales Charts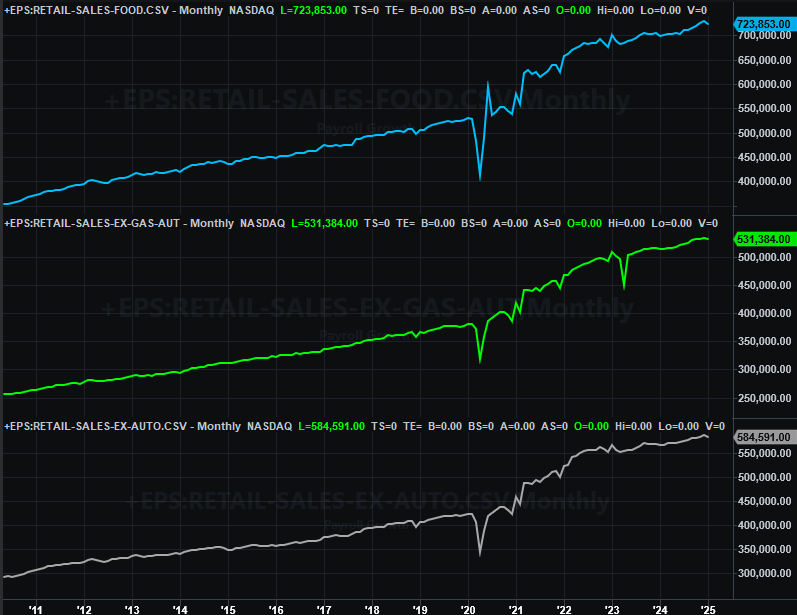
Source: Census Bureau, TradeStation
On Tuesday look for February’s housing starts and building permits. You may recall permits fell a bit the month before, while stars fell even more. Both data sets are stuck in longer-term ranges though, with no real change in the cards this time.
Housing Starts, Building Permits Charts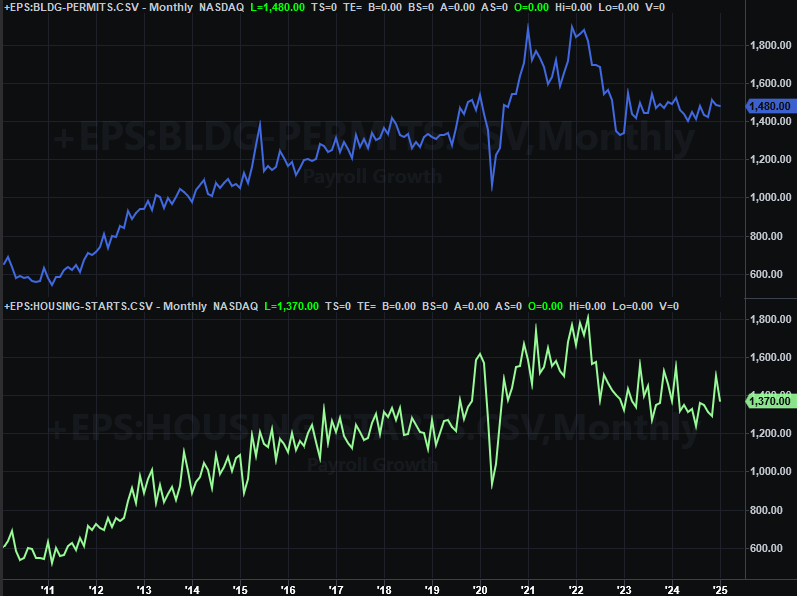
Source: Census Bureau, TradeStation
Also on Wednesday we’ll hear the Fed’s capacity utilization and industrial productivity data for last month. Forecasts call for a slight improvement, but a slight uptick after a few months of respectable forward progress would be a considerable victory.
Capacity Utilization, Industrial Production Charts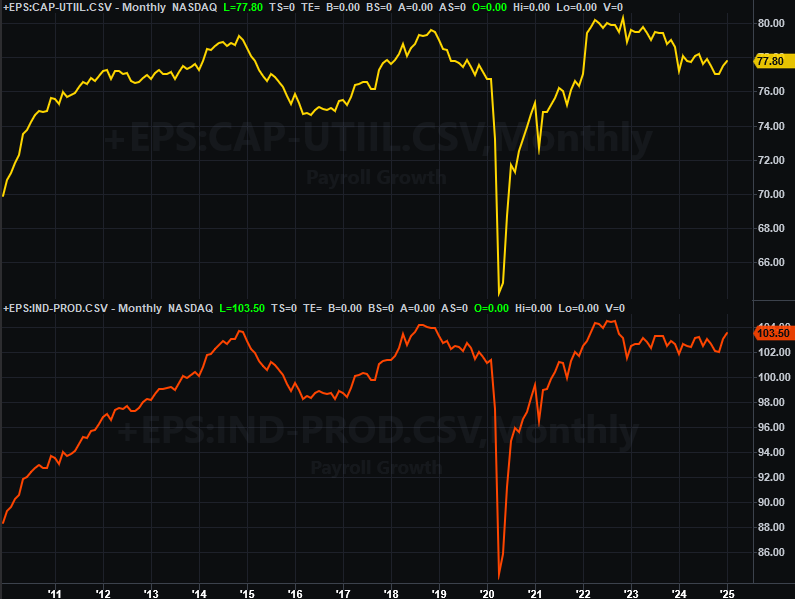
Source: Federal Reserve, TradeStation
Finally, on Friday look for February’s report on sales of existing homes. Like starts and permits, sales of homes (new as well as existing) are erratic, but also range bound at relatively low levels. Existing home sales are likely to fall just a little bit more for last month.
New, Existing Home Sales Charts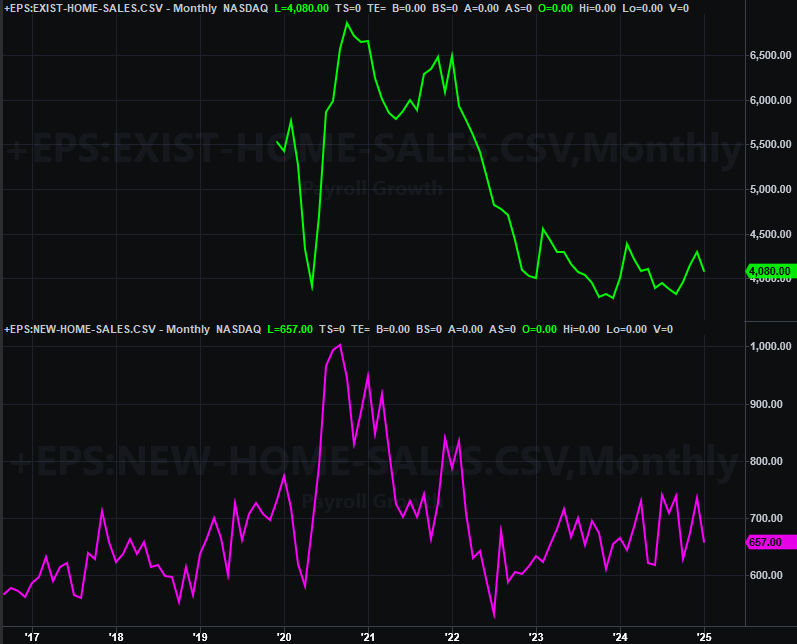
Source: National Assn. of Realtors, Census Bureau, TradeStation
New home sales numbers will be out next week, rounding out this number.
Stock Market Index Analysis
Friday’s reversal from the rout that unfurled during the first four days of last week was brilliantly bullish to be sure. But, don’t get too encouraged just yet. Although anything can and will (eventually) happen, the selling we’ve seen so far doesn’t look like a true bottom-making capitulation. Friday’s move looks more like a dead-cat bounce… something you see simply because it’s been dropped from a high enough high.
Take a look at the daily chart of the S&P 500 below to see why. From peak-to-trough, the index finally made a full 10% correction in less than four weeks, and then bounced. It’s arguable, however, that some would-be buyers were just waiting to plow in at the 10% pullback point. They did. But, are there enough of these people to keep the new bullish effort moving? Given the lack of volume behind the big gain, it doesn’t appear there is.
S&P 500 Daily Chart, with VIX and Volume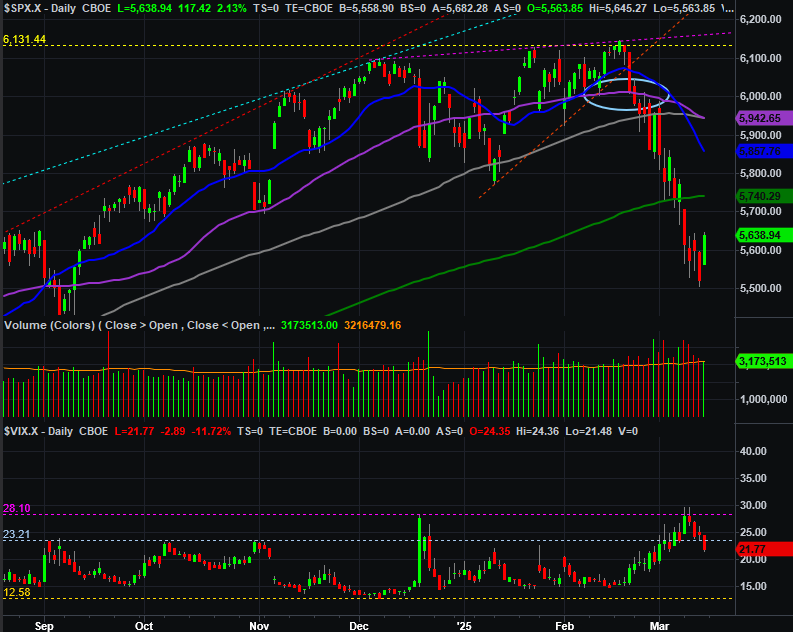
Source: TradeNavigator
Sure, the volatility index (VIX) made its correlating reversal at a semi-established ceiling around 28 (pink, dashed). Again though, Friday’s bounce is suspect, and far from being the ideal capitulation.
The weekly chart of the S&P 500 below puts things in a bit more perspective. As you can see, the index is now well below the lower boundary of the rising trading range that goes back to its late-2023 low (yellow, dashed), as well as below its 200-day moving average line (green) at 5,770. It’s still far a bit aways from being back above both… or either one, for that matter.
S&P 500 Weekly Chart, with VIX and MACD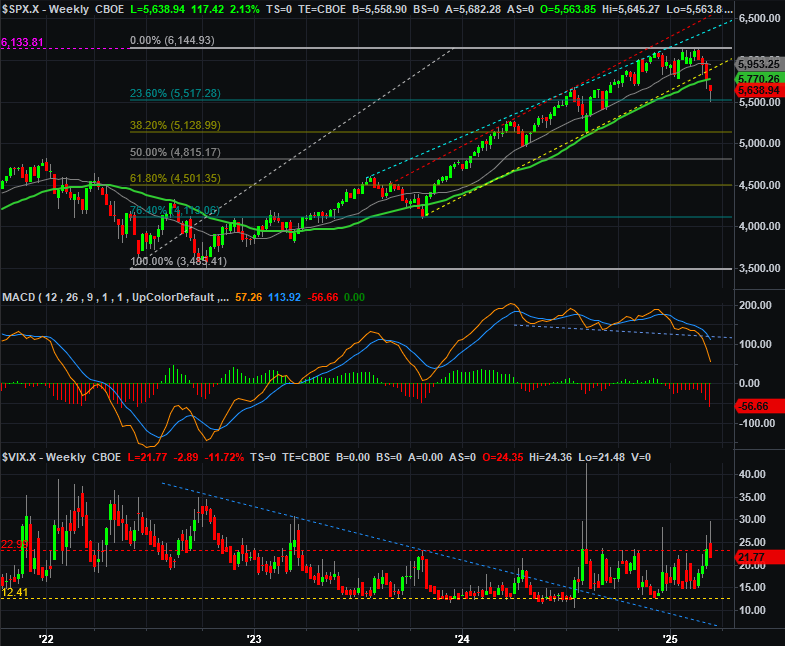
Source: TradeNavigator
The piece of the weekly chart to really notice, however, is the 23.6% Fibonacci retracement line at the 5,517 level, which is essentially where the S&P 500 made last week’s low… where traders would be psychologically motivated to make a stand against the selling. They did. It just remains to be seen if they’ll maintain this interest in defending this line in the sand well enough to keep the market propped up long enough to let all the bulls regroup and restart the bigger-picture bull market.
The 23.6% retracement level isn’t nearly as significant as the 38.2% retracement mark. A slide to that mark at 5,129 would be far more likely to be capitulatory, as well as enough of a pullback (16.5% from peak to trough) to really “clear the decks” and allow the bull market to reset and resume.
And the NASDAQ Composite’s bounce on Friday is just as understandable. While it briefly traded under this level on Thursday, there’s clear support at the lower boundary of its rising bullish channel. That is to say, this is where you’d expect at least some buyers to pour back in following a pullback. Now let’s see if there’s enough of them that are confident enough to continue the effort. As was already noted of the S&P 500, we’re not hopeful that will be the case. We need to see a bit more pain and panic before the ideal, long-lived bottom is made… probably.
NASDAQ Composite Weekly Chart, with VIX and MACD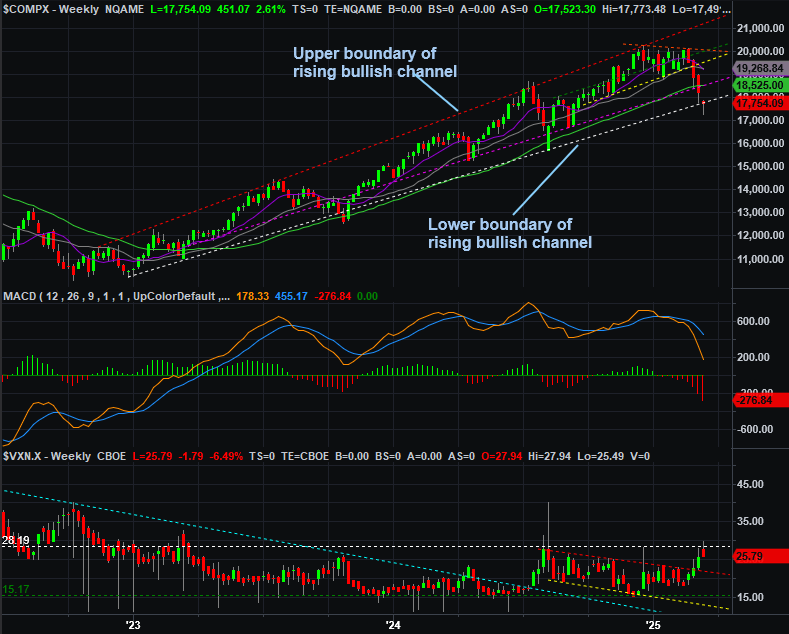
Source: TradeNavigator
With all of that being said, perhaps the best move to make right now is not making any move at all, and just taking a step back and waiting to see how this all shakes out. This is one of those situations where the recent past tells us very little that’s definitive, or even firmly suggestive. This upcoming week’s interest rate decision — and commentary surrounding it — makes it even more dangerous to start taking sides here.
Our bigger-picture guess, however, is that we’re still ultimately due for a lower low before the big, capitulatory bottom is made.