The market followed through on its recovery effort from two weeks ago, pushing its way to record highs last week. It's hardly the perfect advance to new highs though. Not only are stocks now well overbought and ripe for profit taking, the conviction behind last week's progress is far from convincing. It's also the wrong time of year for this degree of strength.
Crazier things have happened though, and a clear end to the tariff war could still incite some serious buying.
We'll weigh the headwinds and tailwinds in a moment. First, let's look at last week's major economic announcements, which includes a review of June's surprisingly healthy employment report.
Economic Data Analysis
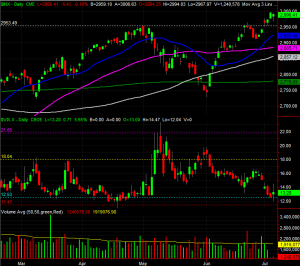
No sense in delaying the most important data nugget from last week. In June, though the nation hired 224,000 (net) new employees, the unemployment rate edged up from 3.6% to 3.7%. It's still incredibly impressive. A record number of people are now working. The only reason the unemployment rate ticked higher was a flood of entrants – new and prior – into the workforce that haven't yet secured a position. The job openings are there, however, if an individual is willing to work.
Payroll Growth and Unemployment Rate Charts
 [1]
[1]
Source: Thomson Reuters
The complete employment report along with deeper looks at wages and participation factors is available at the website here: https://www.bigtrends.com/education/markets/junes-slight-uptick-in-unemployment-actually-indicates-health
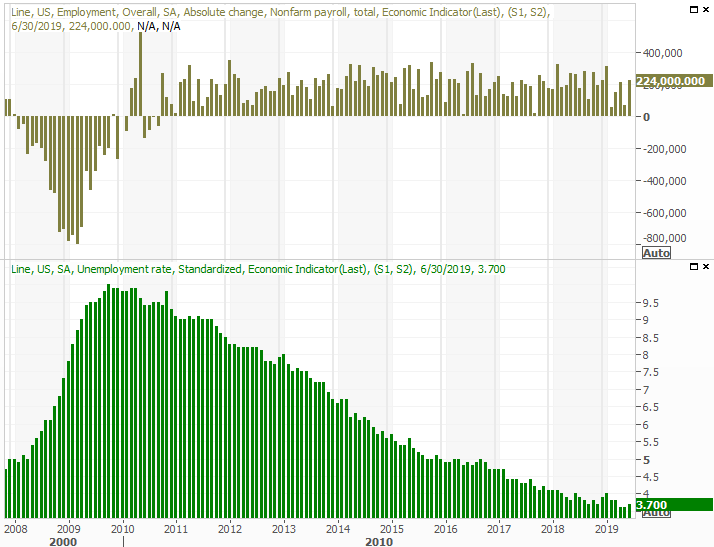
The jobs report was hardly the only big data worth examining last week however. We also got both ISM reports. Unfortunately, both were disappointments. Each remains above the critical 50 level, but it's clear each is in a persistent downtrend.
ISM Manufacturing, Services Index Charts
 [2]
[2]
Source: Thomson Reuters
Do note that both ISM indices are opinion polls, and not supported by quantitative measures. It's possible that the purchasing managers being asked about the future are responding based on their perception of a slowdown rather than an actual slowdown taking shape.
Last week also gave us June's tally of automobile sales. Not bad. While still not as strong as the 'peak auto' wave from just a few years ago, it's possible car and truck purchases could be leveling off. Now four years removed from the peak-auto phenomenon, we may quietly be slipping back into a replacement phase.
U.S. Automobile Sales Charts
 [3]
[3]
Source: Thomson Reuters
Everything else is on the grid.
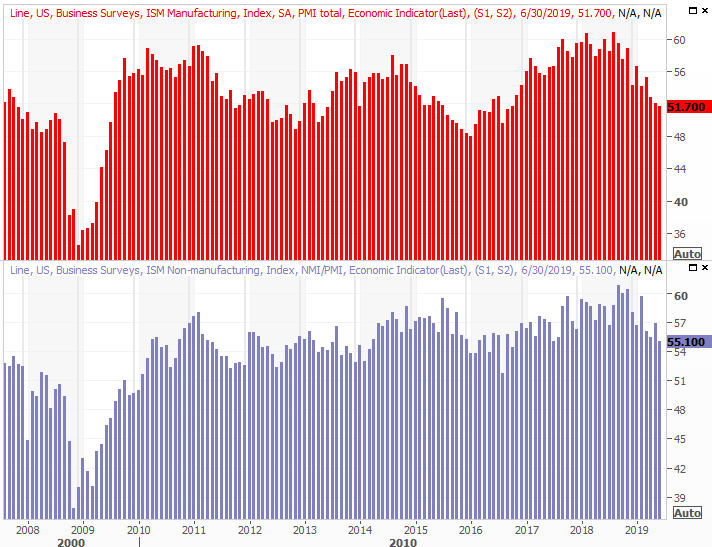
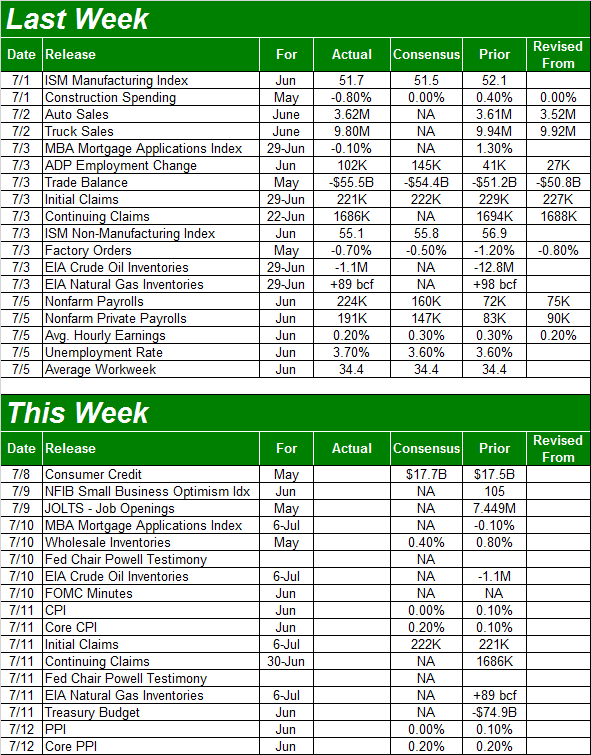
Economic Calendar
 [4]
[4]
Source: Briefing.com
This week won't be quite as busy, though there are still a couple of biggies on the dance card.
First and arguably foremost, the minutes from the most recent FOMC meeting will be released. This isn't a scheduled time to make an interest rate decision, though the discussion and wording used to disclose what the Fed's voting members discussed will offer at least a little more insight as to what they see on the horizon.
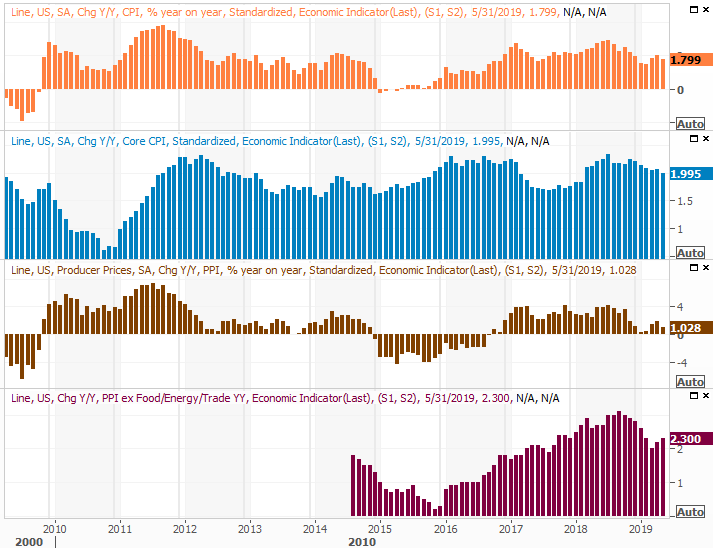
To that end, much of what they see on the horizon will stem from another round of data also scheduled for release this week. That's a look at June's inflation numbers. The consumer inflation report will be posted on Thursday, followed by a look at consumer inflation on Friday. Economists aren't looking for any change, which implies 'the' inflation rate should remain somewhere around 1.8%.
Consumer, Producer Inflation Charts
 [5]
[5]
Source: Thomson Reuters
The tame inflation environment clearly means there's no need or reason for a rate hike, though for weeks now the discussion has largely been an anticipation of a rate cut. To the extent inflation helps guide those decisions though, we're not seeing prolonged phases of limited or even negative inflation (deflation) that would necessitate such an action. In short, stagnant inflation rates are ideal, as it suggests the economy is moving forward but not overheating in such a way that leads into an inevitable growth-killing meltdown.
Let's just hope that the stagnant inflation rates are not transitory, from stronger inflation just a few months ago en route to more tepid levels.
That's probably not what's taking shape here, but it is worth bearing in mind.
Stock Market Index Analysis
Last week's 1.65% gain now has the S&P 500 up 8.7% for just the past five weeks… a remarkable run in a fairly short period of time. More remarkable is the fact that the index is now up roughly 25% in just a little over six months. Granted, it started that move out deep in the hole thanks to Q4's surprisingly strong selloff, but even then the advance has been 'unprecedented' by historical standards.
It's not as if the advance has left the market in an ideal situation though.
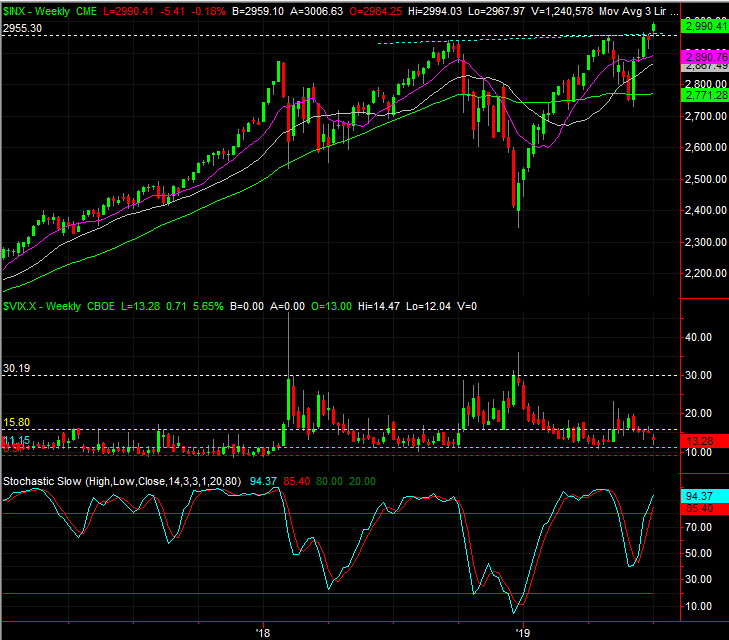
We'll start this week's analysis out with a look at the weekly chart of the S&P 500, painting with some broad brush strokes. Note that May's pullback hardly bled off the froth built up from the January-April advance. That's not just a qualitative premise though. As of Friday, the S&P 500 is now 7.9% above the 200-day moving average line, plotted as a green line on all the stock charts you'll see here. For perspective, the early-May divergence was only 6.6% above the 200-day line, and the January-2018 divergence was a short-lived 13.3% that led to a sizeable pullback. The typical maximum separation between the two is around 7%.
S&P 500 Weekly Chart
 [6]
[6]
Source: TradeStation
That's not the only concern on the radar though. Also note that the VIX got very close to reaching a significant support area around 11.1. That's not the absolute low, but it's a pretty critical floor. You'll also see on the daily chart that the VIX's shape on Friday was a doji, where the open and close are near the middle of the high-low range.
S&P 500 Daily Chart, with VIX, Volume
 [7]
[7]
Source: TradeStation
The daily chart also serves up another red flag… volume, or the lack of it behind the biggest gains from last week. The holiday certainly played a role in crimping trading activity, and there may be lots of volume behind any gains in the cards this week. But, as it stands right now, we don't know that this recent wave of bullishness is supported by a great deal of conviction.
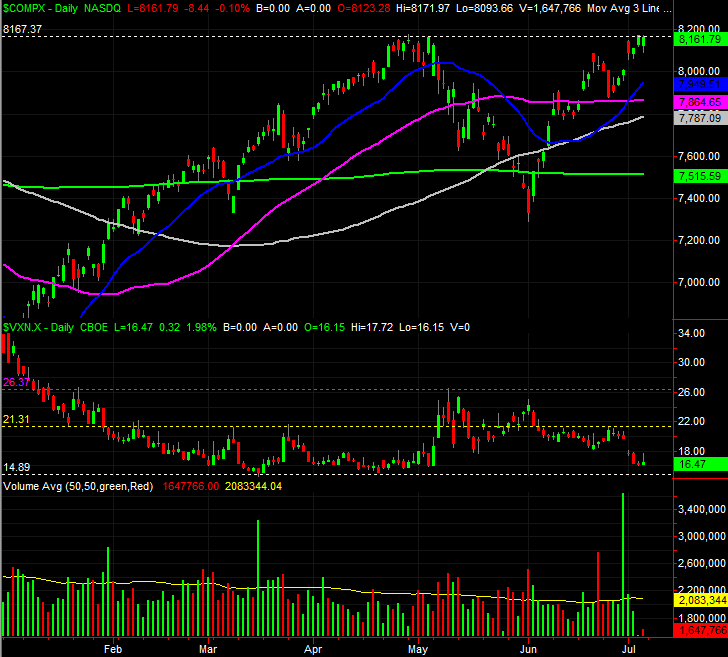
And there's one more concern to note, evident on the daily chart of the NASDAQ Composite. Unlike the S&P 500, the composite was unable to push its way to record highs last week. Rather, the late-April/early-May peak is still serving as a technical ceiling.
NASDAQ Composite Daily Chart, with VXN, Volume
 [8]
[8]
Source: TradeStation
It's a problem, because the NASDAQ should be leading the market, higher and lower. If it's lagging now, it suggests investors are plowing into the aggressive, higher-risk stocks one would expect them to be interested in when a rally's got room and reason to keep running.
On the flipside, the technology sector – though not the NASDAQ – has led the overall charge since the early June low. That's something, though mostly it points to how confused traders are at this time. That makes them capable of doing anything.
As was the case a week ago, assume nothing here. In a normal environment we could count on a profit-taking pullback, and the wrong headline could still easily pull the rug out from underneath the market. This isn't a normal environment though. This is still a headline driven environment, and investors are still more likely to respond to rhetoric surround inflation and interest rates than reasonably translate fundamentals into stock prices.
Whatever the case, this isn't a time to add new long positions, even if stocks continue to drift a little higher. The tank is on 'E,' and the rally is running on fumes. We need a good reset… one bigger than the one we saw in May.