
Picking up where they left off a week earlier, the bulls logged another gain during the holiday-shortened week. All told, the S&P 500 gained another 1.0% last week, tiptoeing into record-high territory as a result. The momentum is obviously bullish.
It’s bullish with a big asterisk, however. That is, the gains suspiciously stopped at an established technical ceiling. And that wasn’t the only hint that the market might have just reached at least a short-term high. The other red flag is the fact that traders are now suspiciously complacent.
Of course, it’s difficult to ferret out how much of last week’s action is the market’s true nature right now, or just the result of the action surrounding the holiday. Nevertheless, where and how we ended things last week is where and we’ll start things this week. That matters.
We’ll get to what’s likely in the cards this week in a moment. Let’s first run through last week’s economic announcements and preview what’s coming this week.
Economic Data Analysis
There wasn’t a ton of news dropped last week, but what we heard was pretty important. Take, for instance, Tuesday’s look at home price data. Although the numbers were up for September versus August’s figures, the Case-Shiller 20-City Index continues to dwindle from June’s peak while the FHFA Home Price Index now seems to be accelerating higher. As we noted last week, this may be a reflection of the fact that higher-end home sales are slowing, but demand for more affordable homes continues to firm up… even if only out of desperation for affordable housing.
Home Price Charts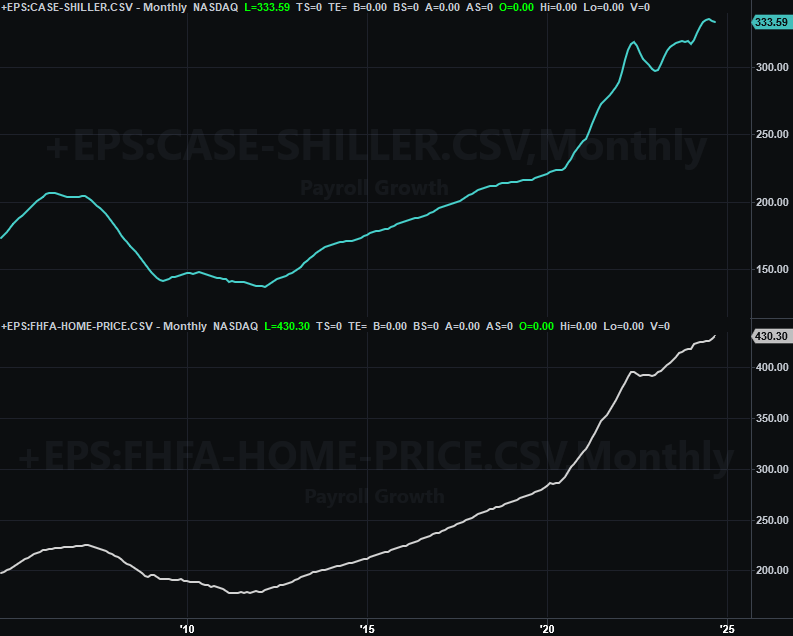
Source: Standard & Poor’s, FHFA, TradeStation
Just bear in mind that pricing is only half the story. Total home sales remain weak, with most would-be buyers (perhaps of less-expensive houses) still on the sidelines, waiting for a better time to buy.
How do we know? Also on Tuesday we got last month’s new-home unit sales report from the Census Bureau. Sales of existing homes edged a little higher in October, but are still pretty low. Meanwhile, unit sales of only 610,000 new homes was a major disappointment compared to expectations, as well as
New, Existing Home Sales Charts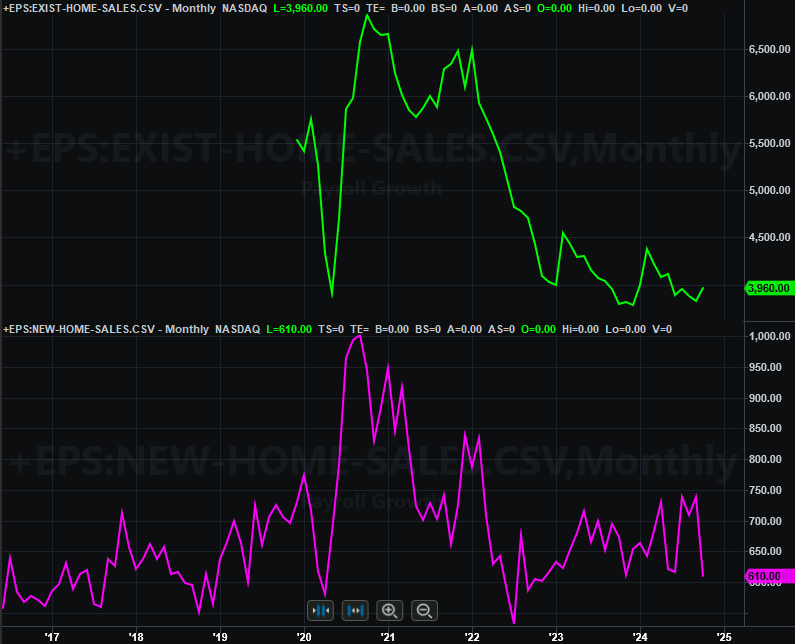
Source: Census Bureau, National Assn. of Realtors, TradeStation
We heard November’s update of the Conference Board’s consumer confidence score on Tuesday of last week as well. It ticked higher (like the University of Michigan’s consumer sentiment measure a week earlier) as expected, but even more than expected. It’s still too soon to call it a trend, but it does appear that consumers are at least seeing reason for hope.
Consumer Sentiment Charts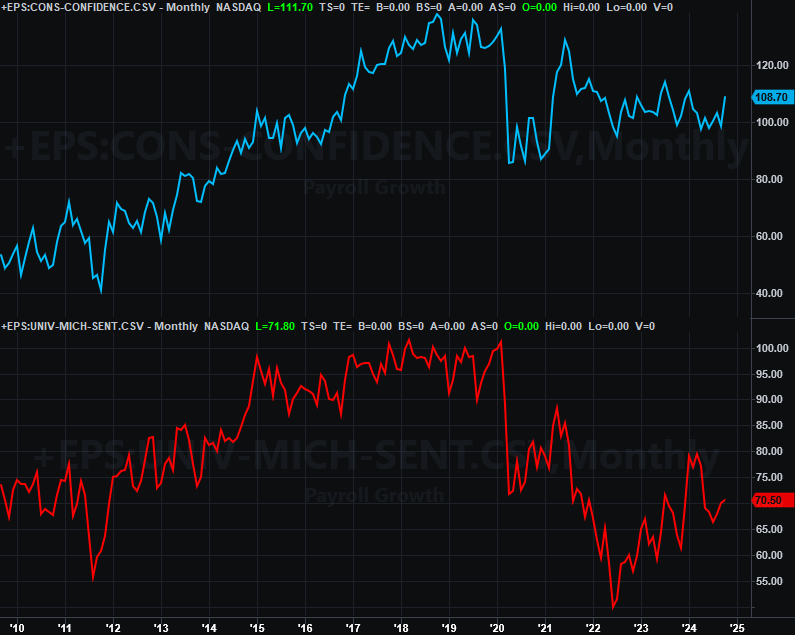
Source: Conference Board, University of Michigan, TradeStation
We’re not charting it here, but also know that October’s personal spending and personal income once again were up… although not excessively so. It matters simply because the Federal Reserve closely considers this information when making interest rate decisions. These numbers give the FOMC a little breathing room, but it’s still not clear the Fed can proceed with its plans for a string of several rate cuts over the course of the coming year.
Everything else is on the grid.
Economic Calendar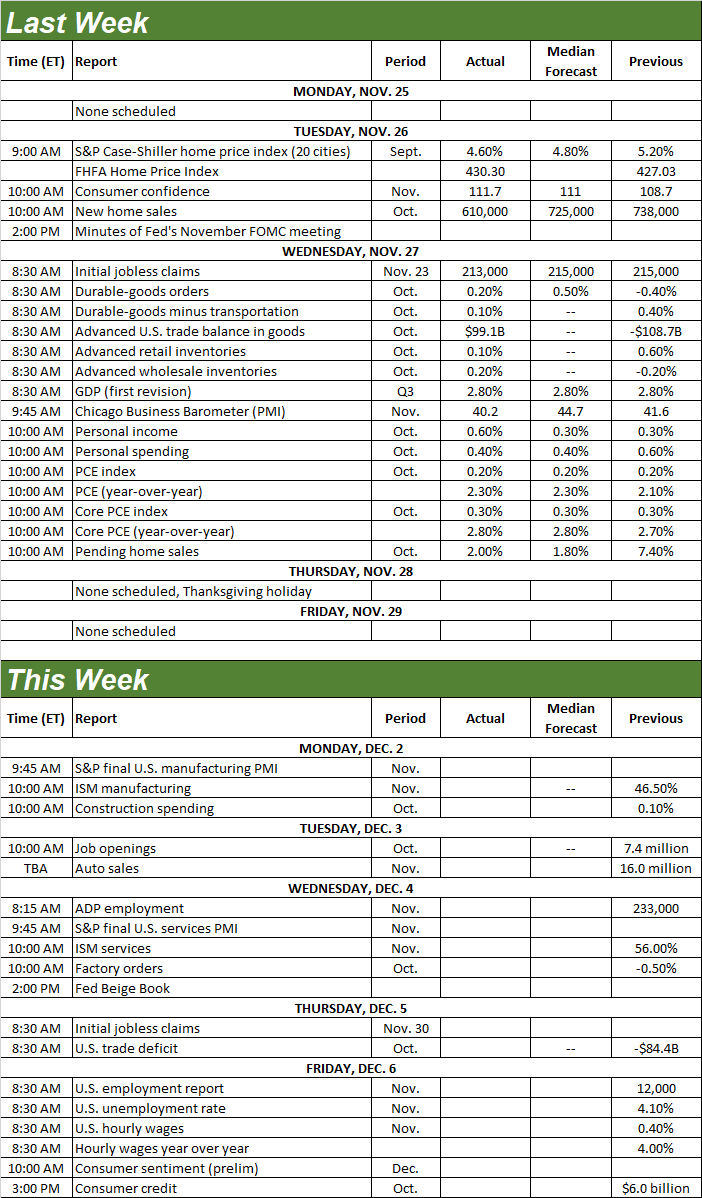
Source: Briefing.com
This week’s got a couple of important items in the lineup.
One of these is last month’s manufacturing and services activity barometers from the Institute of Supply Management (or ISM) on Monday and Wednesday, respectively. Manufacturing activity has been cooling, while services activity has been heating up, reaching multi-month highs in October. That’s not surprising given that the U.S. is mostly a services-based economy. Still, it’s concerning that manufacturing activity isn’t really still bouncing back from its pandemic-prompted slump.
ISM Services, Manufacturing Index Charts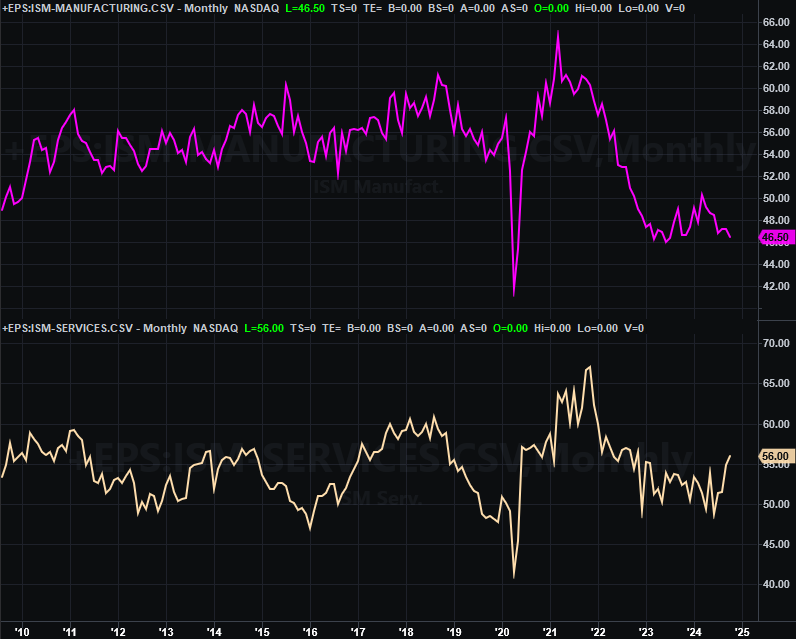
Source: Institute of Supply Management, TradeStation
This week’s biggie, of course, will be Friday’s jobs report for last month. You may recall that slowing job growth came to a near halt a month earlier. The unemployment rate came down for a couple of months anyway though. Sooner or later, one of these two opposing trends is going to have to reverse course. Given the unlikelihood that it will be payroll growth thanks to the so-so state of the economy, look for the unemployment rate to tick upward.
Payroll Growth, Unemployment Charts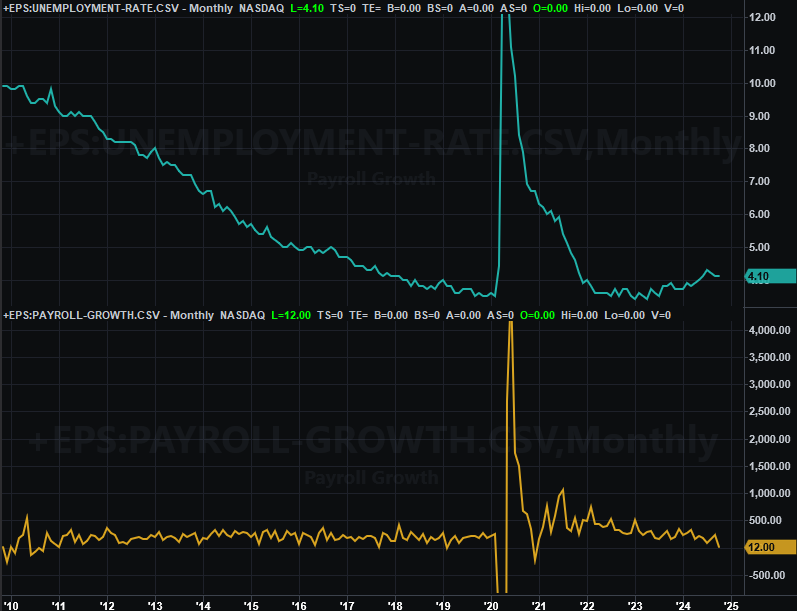
Source: Department of Labor, TradeStation
Stock Market Index Analysis
We kick things off this week with a look at the weekly chart of the S&P 500 simply because it’s important to paint the bigger picture first. Namely, note that the index — already in long-term rally mode — bumped into one of two upper boundaries (light blue, dashed) that have kept the gains in check since the middle of last year. Also note that the volatility index (VIX) is back near a major technical floor around 13 (yellow, dashed). Neither of these inherently mean the rally must end here. It does mean, however, any continuation of the rally gets much tougher from here. [Extremely rich valuations, of course, also present a challenge.]
S&P 500 Weekly Chart, with VIX and MACD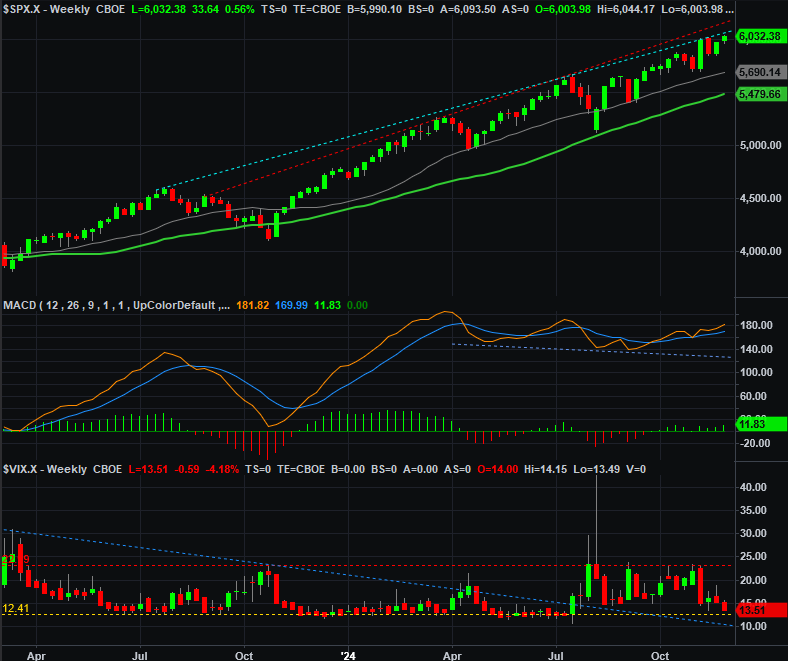
Source: TradeNavigator
Here’s the daily chart of the S&P 500 for a little more detail. Still the same story though.
S&P 500 Daily Chart, with VIX and Volume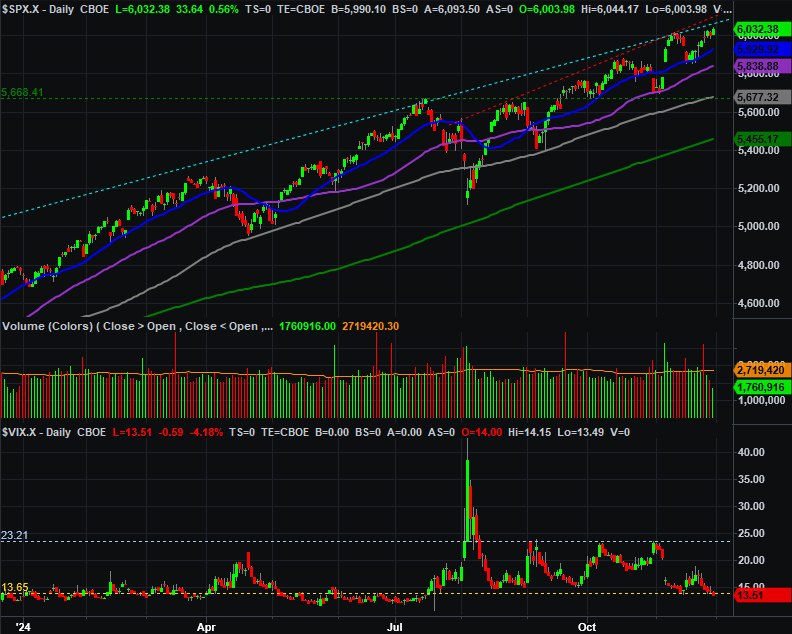
Source: TradeNavigator
Here’s the weekly chart of the NASDAQ Composite. It’s telling a similar (although not identical) story. That is, it’s being steered higher by and within a rising trading range that’s been in place since early 2023. And, since August’s low, the composite’s being steered higher by a more-sharply-inclining floor (yellow, dashed). Notice there’s still room for the NASDAQ to continue rising before it bumps into the upper boundary of its long-term rising channel (red, dashed) currently at 20,450. Also notice that — like its S&P 500 counterpart — the NASDAQ’s volatility index (VXN) is now back at absolute lows. This will make it tough for the composite to keep climbing, although the shape of the NASDAQ itself does leave room for more upside.
NASDAQ Composite Weekly Chart, with VIX and MACD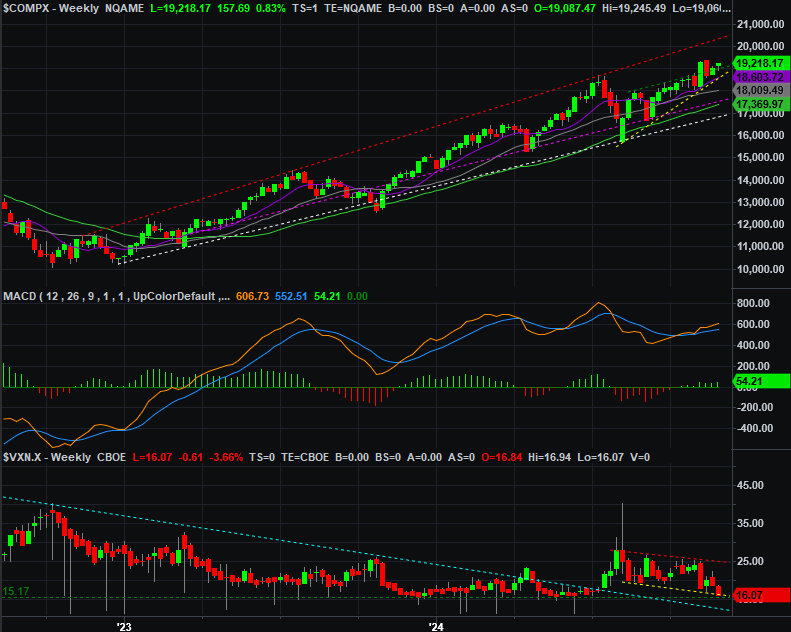
Source: TradeNavigator
The daily chart of the NASDAQ provides a little more detail about the rising converging wedge pattern, and particularly the fact it’s starting to poke its head above the upper boundary of this near-term technical ceiling (green, dashed). More than that though, notice how the composite is finding supports at its 20-day moving average line (blue) at 18,961. It’s going to take some work to break under this floor, but if it happens — as overextended as the composite is at this point — it may start something of a selling avalanche.
NASDAQ Composite Daily Chart, with VXN and Volume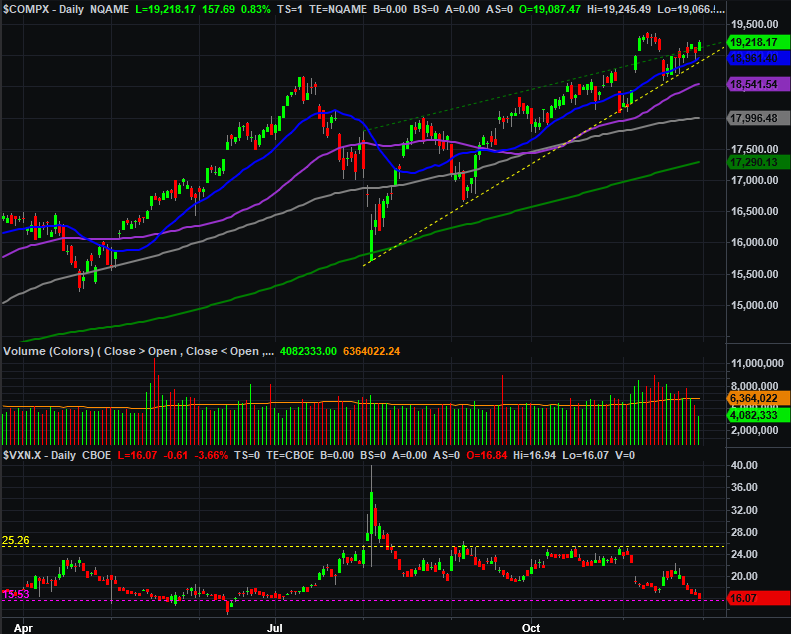
Source: TradeNavigator
So what’s the call? We’re first and foremost momentum traders, so we must remain bullish here. It’s an incredibly uncomfortable bullishness though. The time of year is bullish, but this year-end bullishness usually takes shape after an autumn lull. We didn’t start this phase out with that advantage though. Indeed, the market’s 70% runup from its late-2022 low (and lack of real correction ever since) leaves stocks incredibly vulnerable despite the current momentum.
Just be smart. It’s not happening yet, but there’s little doubt we’re due for some sort of correction sooner than later. You’ll know it’s starting when the indexes finally start breaking under technical support lines more than it’s finding support at them.