
Despite a fairly slow start, the bulls finally got things moving again to hammer out a second winning week in a row. All told, the S&P 500 advanced nearly 2.9% last and now sits 16% above its early-April multi-month low.
And yet, the index still hasn’t actually crawled back to levels that confirm the tide’s taken a solid enough turn for the better. Namely, the S&P 500 (as well as the NASDAQ) are both still below their 200-day moving average lines, meaning it’s still possible all of this is nothing but a dead-cat bounce. The sheer scope and speed — and now a couple of bullish gaps left behind now waiting to be filled in — of the gain underscores this concern.
We’ll take our usual detailed look at all of these things in a moment. First, let’s look at last week’s big economic news and preview the announcements scheduled for this week.
Economic Data Analysis
The party started in earnest on Tuesday, with an important update on the real estate front. The S&P Case-Shiller Home Price Index improved another 4.5% (YOY) to rekindle its bigger-picture uptrend, while the FHFA Home Price Index also made forward progress (albeit at a slower pace) to reach yet-another record.
Home Price Index Charts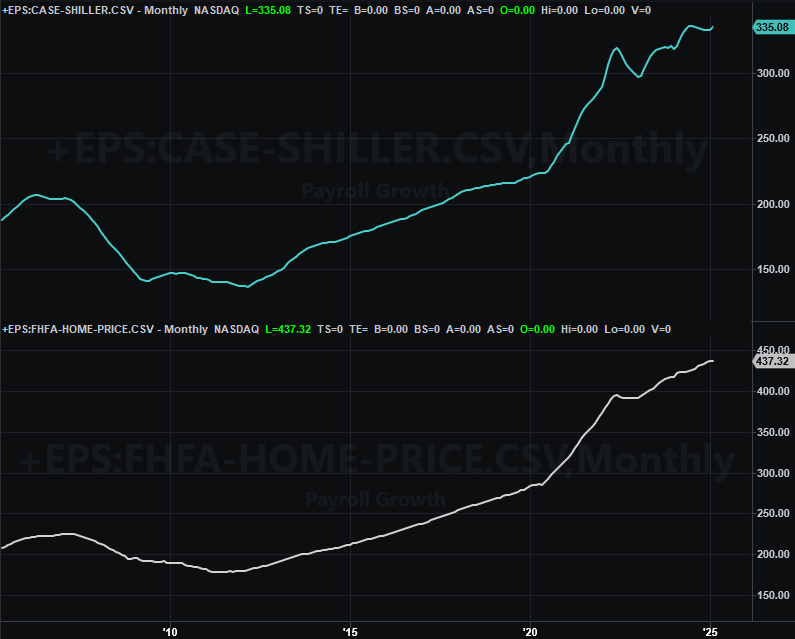
Source: FHFA, Standard & Poor’s, TradeStation
Just remember that these home prices only consider prices of homes that are actually sold. It doesn’t reflect prices of homes that aren’t selling, and home sales remain at multi-year lows. At least pricing power remains decent though, even if fewer homes are transacting.
We also completed April’s consumer sentiment snapshot on Tuesday, with the Conference Board’s consumer confidence report of 86.0. That’s well down from March’s reason of 93.9. It’s back toward levels last seen in the earliest days of the COVID-19 pandemic, in fact. (The University of Michigan Sentiment Index posted a week earlier tells the same story.)
Consumer Sentiment Charts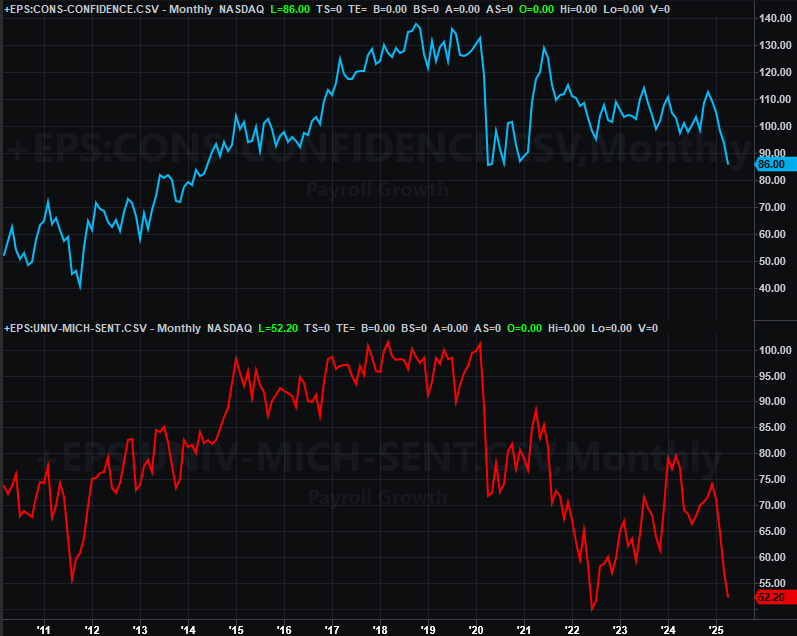
Source: Conference Board, University of Michigan, TradeStation
We’re not charting either one here, but also know that Q1’s first look at GDP as well as April’s consumer income and spending data on Wednesday. GDP growth actually turned negative, but only because of a huge wave of pre-tariff imports. Incomes and expenditures were also generally positive, but not so positive that the Federal Reserve may be hesitant to dial back interest rates due to fears that inflation could heat up again.
Last week’s big news was of course the jobs report for April. Payroll growth of 177,000 was measurably better than the expected 133,000, but down from the downward-adjusted number of 185,000 for March. That modest-but-positive number allowed the unemployment rate to hold steady at 4.2%, which — all things considered with the tariff-rattled economy — is respectably decent.
Unemployment Rate, Payroll Growth Charts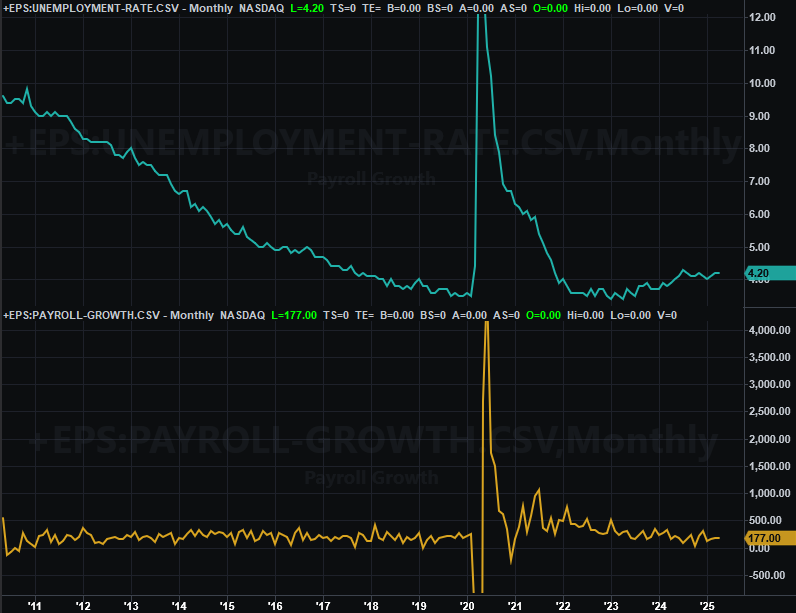
Source: Bureau of Labor Statistics, TradeStation
Everything else is on the grid.
Economic Data Report Calendar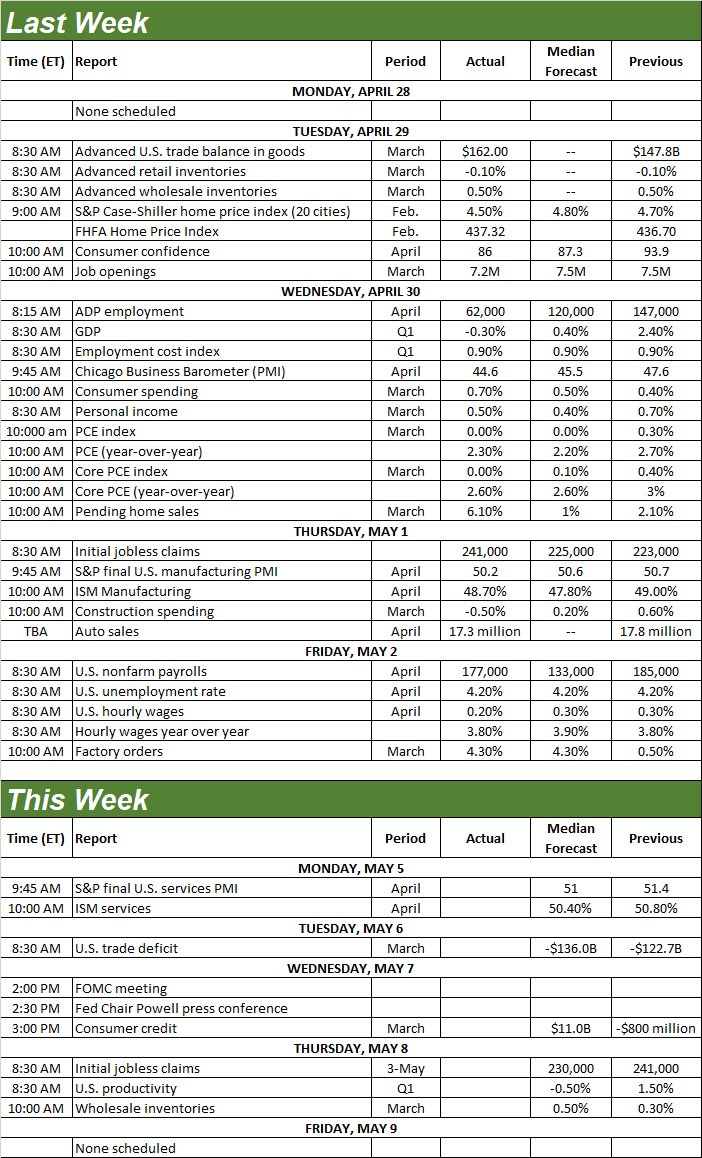
Source: Briefing.com, TradeStation
This week is quite light, actually, although we’ll be getting the second half of a data set we got the first half of this past week. That’s the Institute of Supply Management’s barometers of economic activity. The ISM Services Index is expected to slip a little bit on Monday, mirroring April’s small dip announced last Thursday for the ISM Manufacturing Index. The former is still above the critical 50 level though, while the manufacturing barometer is now even a little further below the 50 mark that divides growth and contraction.
ISM Manufacturing, Services Index Charts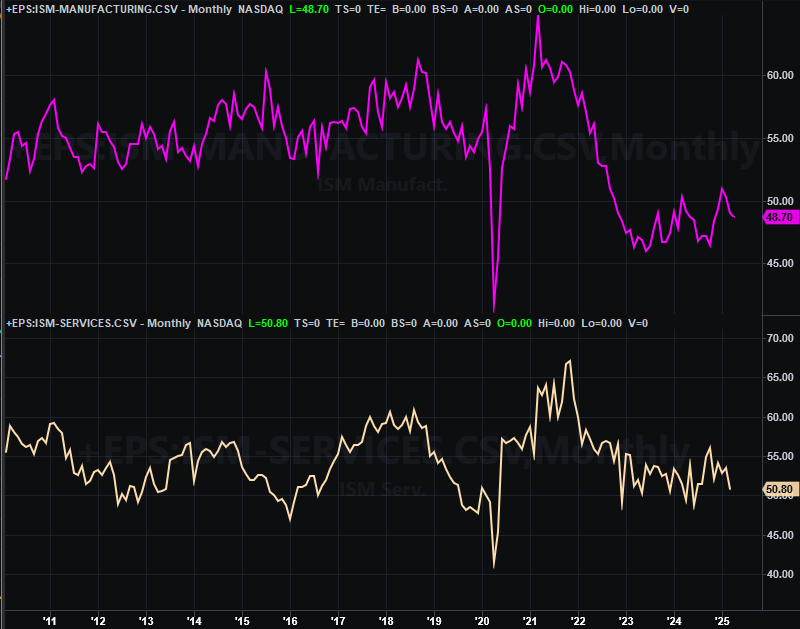
Source: Institute of Supply Management, TradeStation
Regardless, in both instances it appears the ISM’s numbers are moving in the wrong direction again regardless of their present levels.
Stock Market Index Analysis
We kick things off this week with a look at the weekly chart of the S&P 500 simply because we need to understand the bigger picture first. Simply put, after a wobbly start, the bulls got back to work on following through with the big reversal bar from four weeks back. The index is now up 16% from that low, which is quite big run for a fairly short period of time.
S&P 500 Weekly Chart, with VIX and MACD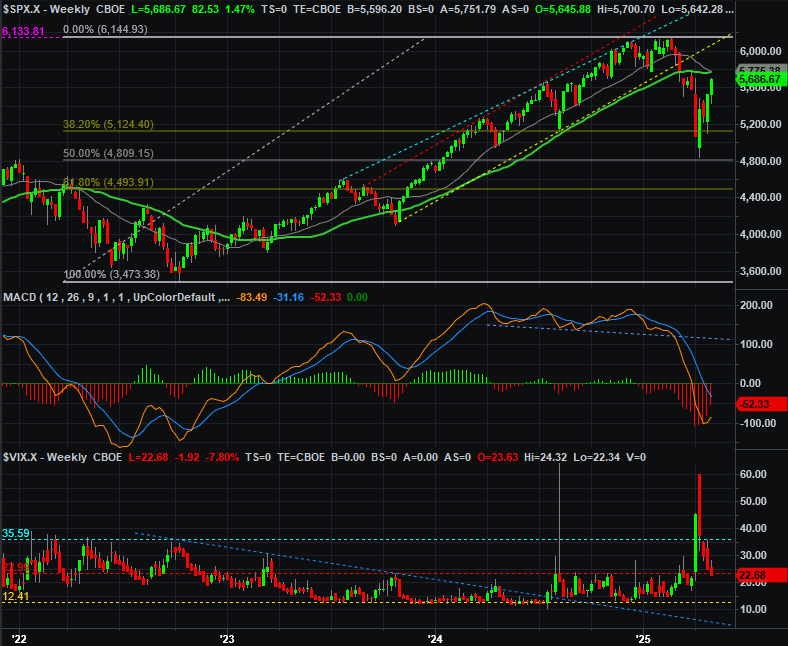
Source: TradeNavigator
The volatility index (VIX) at the bottom of the graph continued to edge lower though… with more room to continue doing so. That means there’s also room for continued upside from the market itself. It’s a possibility with one big potential problem though. That’s the fact that — even with the big four-week runup — the S&P 500 has yet to make its way back above the 200-day moving average line (green) at 5,746. Anything short of that can be chalked up as a dead-cat bounce.
Here’s the daily chart for a bit more perspective. As you can see, the runup from the early April low has been anything but consistent. It’s been downright problematic, in fact, allowing two bullish opening gaps (highlighted in blue) to be left behind that now may be falling to be back-filled. The daily chart also reminds us that there’s still not a great deal of volume — or participation — behind this recovery effort.
S&P 500 Daily Chart, with VIX and Volume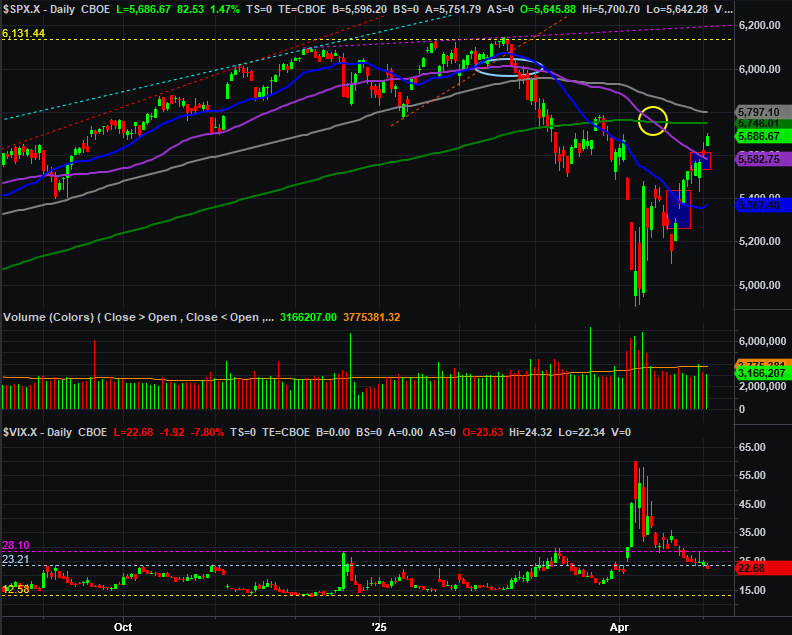
Source: TradeNavigator
Here’s the daily chart of the NASDAQ Composite. It looks about the same, complete with a couple of opening bullish gaps… and a failure to actually test the 200-day line (green) at 18,317. We’re seeing a bit more volume growth on the way up here, but only a bit.
NASDAQ Composite Daily Chart, with VXN and Volume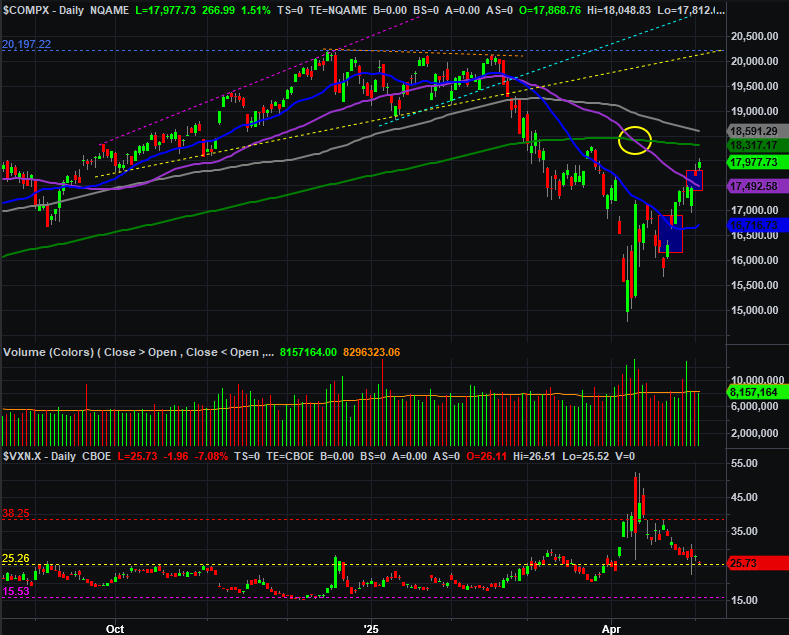
Source: TradeNavigator
The NASDAQ’s got the same basic problem the S&P 500 does though. That’s the sheer speed of the recovery effort thus far.
It’s not likely to be a coincidence that either index has rallied as well as they have without making any meaningful technical progress. That’s often the result following a sharp selloff like the one we saw in February and March. This is not yet a proven recovery. So far, this is just post-plunge volatility.
That doesn’t mean it won’t become more. Just don’t be too quick or anxious to expect that outcome. The 200-day lines loom above, and on both charts that long-term moving average line is now sloped downward. That’s a hint that the bigger-picture undertow is bearish, which leaves the market for more vulnerable than it may seem to be on the surface. All it might take is a test of the 200-day moving average lines to spark the unwinding of this wobbly rally.
By the way, if you’re looking for potential landing spots for any pullback, the S&P 500’s weekly chart still has Fibonacci retracement lines that are good prospects. One’s at 5,124, and the other’s at 4,809. Both have already proven themselves as technical floors. We’ll see. But, first things first.