
In light of Thursday's bullish intraday reversal and Friday's follow-through on the move, stocks ended the week on a high note. In fact, Friday's push was enough to get the market back in the black for the week. It may well be sign that the selling has run its course and we're entering a period of prolonged bullishness.
The fact of the matter is, however, it's too soon to make that call. Even with the big bounce, all of the indices are still below critical technical ceilings. And, it's arguable the only thing that set up the reversal last week was the sheer scope of the selling over the course of the ten prior days… which still hasn't been anything close to unwound.
We'll look at the matter in detail below, as always. First though, let's review last week's economic reports and see what's coming this week.
Economic Data Analysis
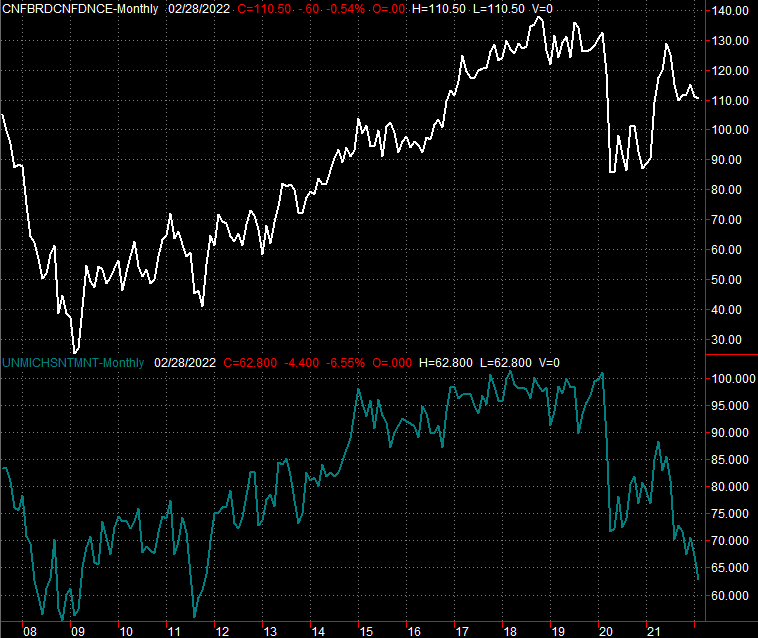
It was a big week last week. Let's just dive in, beginning with February's sentiment measures. Unsurprisingly, they were bad. Both the Conference Board's consumer confidence score and the University of Michigan's consumer sentiment reading fell from January's levels, with the latter falling to levels below readings seen when the COVID-19 pandemic first arrived in the United States back in early 2020.
Consumer Sentiment Charts
 [1]
[1]
Source: Conference Board, University of Michigan, TradeStation
It's a problem simply because investors eventually trade based on what they feel.
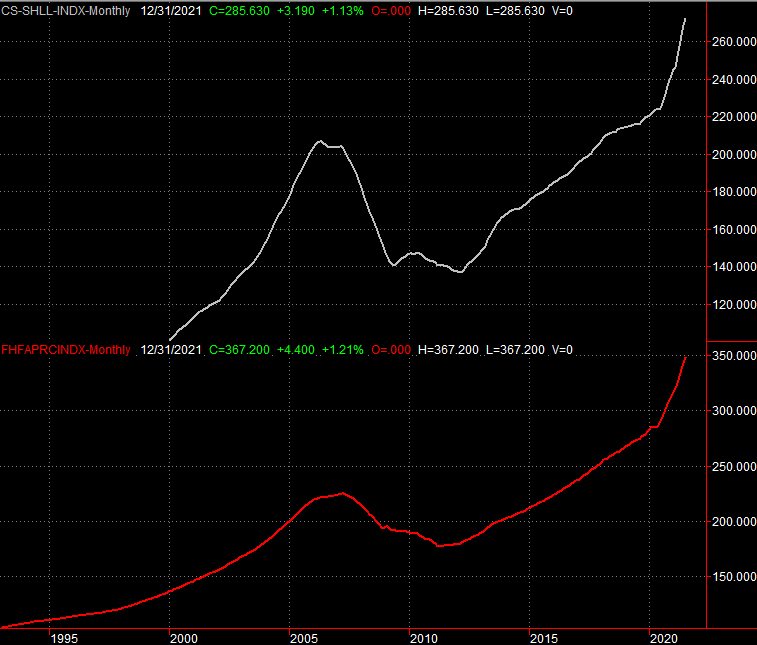
Souring sentiment didn't prevent anyone from continuing to pay higher and higher prices for new homes. Both the S&P Case-Shiller Home Price Index and the FHFA Housing Price Index continue to move deeper into record-high territory. In fact, both accelerated their recent rise.
Home Price Charts
 [2]
[2]
Source: Standard & Poor's, Case-Shiller, FHFA, TradeStation
That data isn't quite as encouraging as it may seem to be on the surface, however. Or, maybe it is.
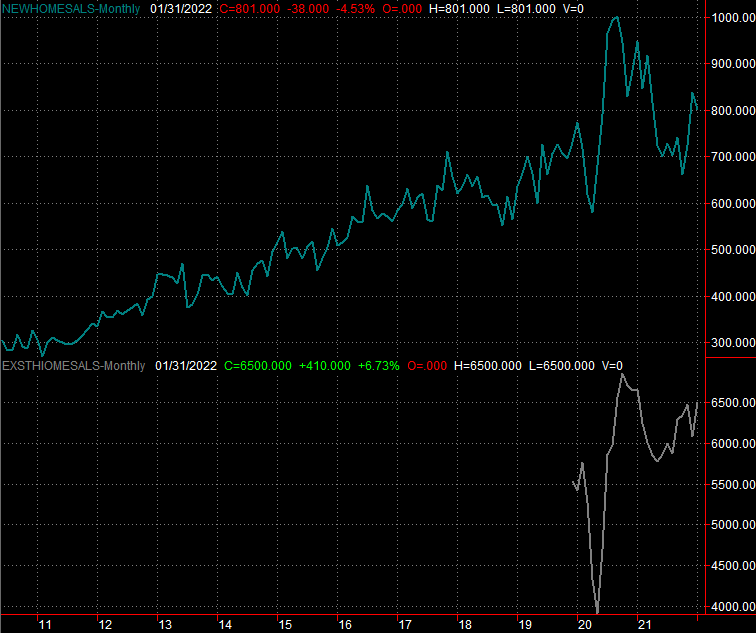
While people are paying more and more for the homes they're buying, they're buying fewer and fewer homes. We learned last week that sales of newly-built houses fell from December's rate of 839,000 to only 801,000 in January. On the other hand, sales of existing homes ticked higher last month, from 6.09 million to a pace of 6.5 million, reclaiming the incredible levels seen in mid-2020.
New and Existing Home Sales Charts
 [3]
[3]
Source: Census Bureau, National Board of Realtors, TradeStation
On balance, the real estate market remains healthy even if other aspects of the market are starting to fade.
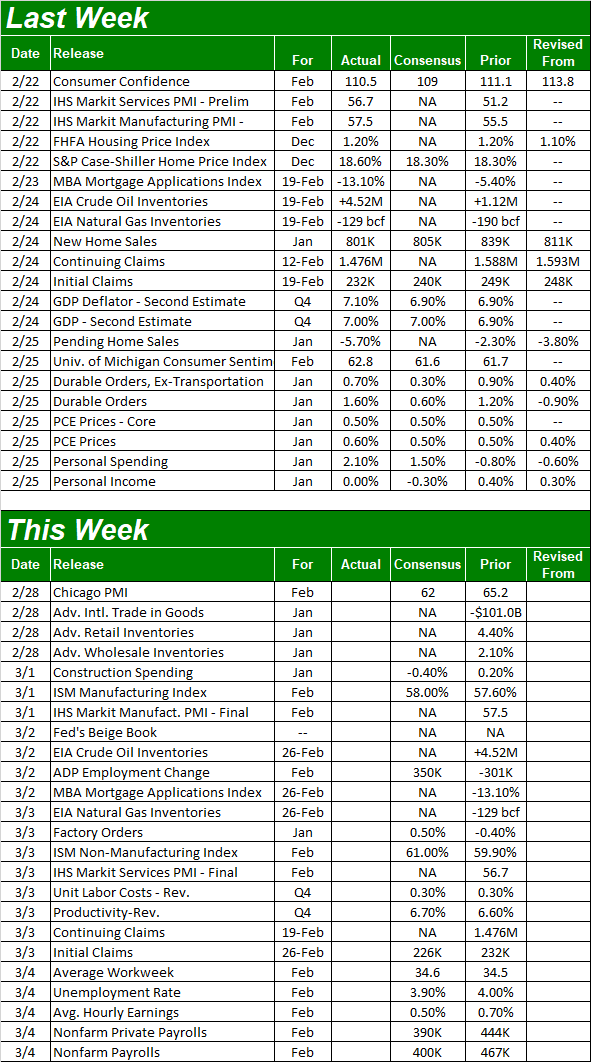
Everything else is on the grid.
Economic Calendar
 [4]
[4]
Source: Briefing.com
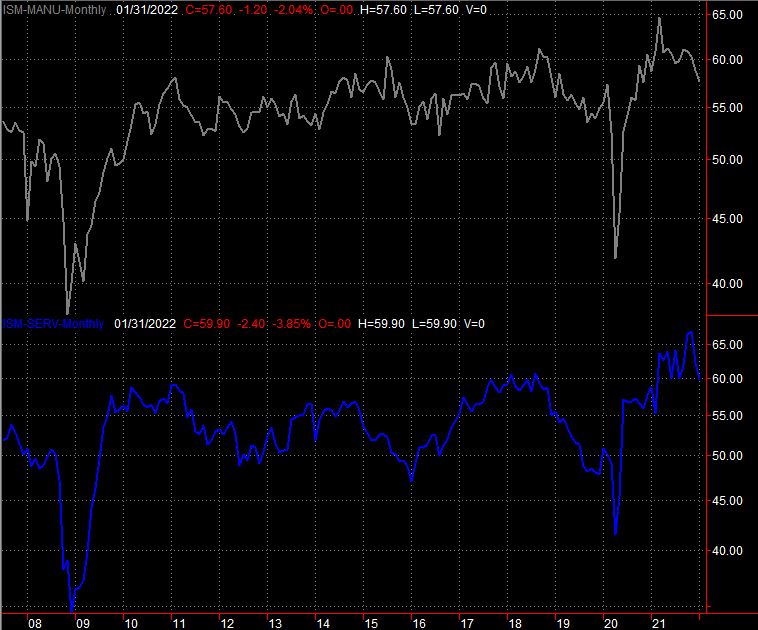
This week is another biggie. The party starts in earnest on Tuesday with February's look at the Institute of Supply Management's measure of manufacturing activity. That will be followed by the ISM's services index score on Thursday. Both are expected to show slight improvements on January's readings, but more importantly, remain above the 50 level that delineates growth and contraction.
ISM Services and Manufacturing Index Charts
 [5]
[5]
Source: Institute of Supply Management, TradeStation
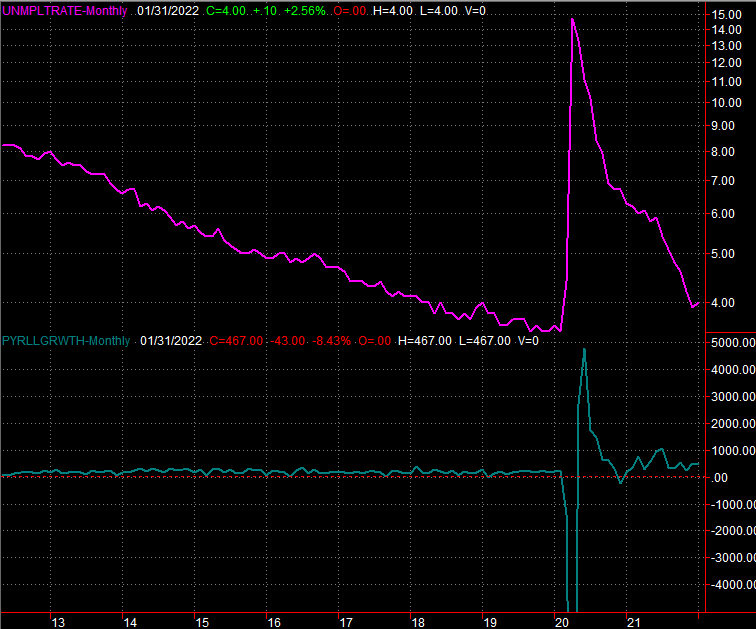
The big Kahuna, however, is coming on Friday. That's when we'll get February's payroll growth and unemployment rate. As it stands right now economists are calling for the addition of 400,000 new jobs, which should be enough to dial the unemployment rate down from 4.0% to 3.9%. Either way, we may be able to get a sense of what's coming on Friday from Wednesday's employment change figure from ADP.
Unemployment Rate and Payroll Growth Charts
 [6]
[6]
Source: Bureau of Labor Statistics, TradeStation
Stock Market Index Analysis
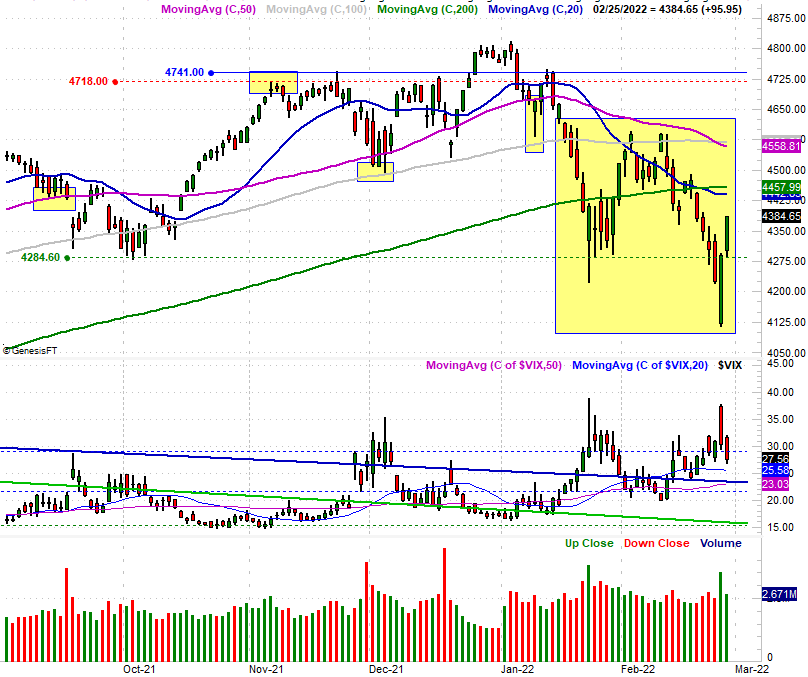
Down as much as 5.4% for the week as of early Thursday, the S&P 500 fought back with a vengeance to log a full-week win of 0.8%. Now with some clear momentum working in its favor, the case for further upside is fairly decent. Excessively strong reversals are also telling, as it suggests there's some resolve behind the move.
S&P 500 Daily Chart, with VIX and Volume
 [7]
[7]
Source: TradeNavigator
Except, last week's bullish rebound isn't exactly ideal, if you're hoping it's a sign that the bull market has been fully restored. Two key problems taint the effort. One of those problems is, the volume behind Friday's advance wasn't huge (and most of Thursday's volume surge actually materialized on the way down). The other problem is, even with the big intraweek rally, the S&P 500 is still below all of its key moving average lines. It's arguable Thursday's and Friday's big rally was nothing more than a dead-cat bounce, and will be short-lived.
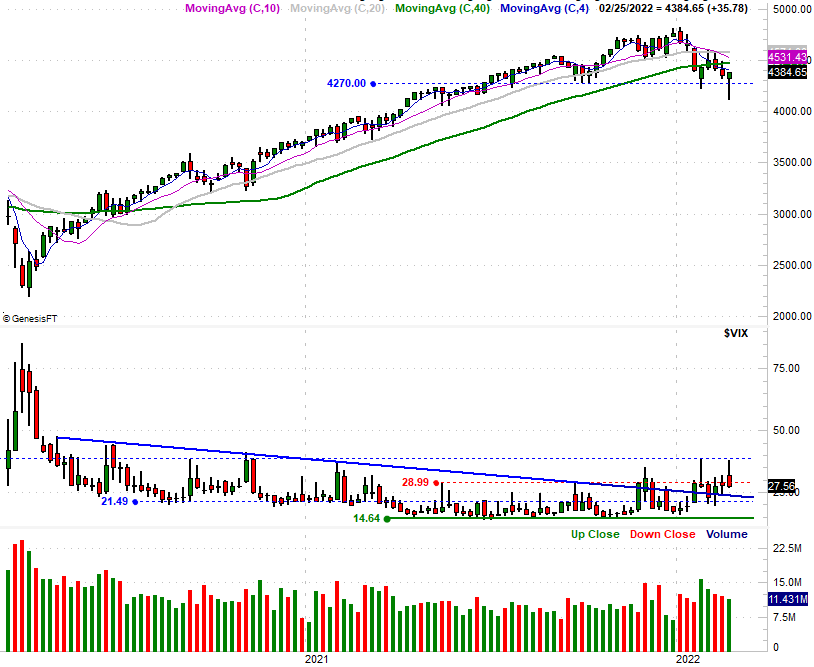
Here's the weekly chart of the S&P 500; note the long-tailed reversal bad from last week, where the open and close are both near the high of a very tall bar… a snapback from a steep-but-temporary lull.
S&P 500 Weekly Chart, with VIX and Volume
 [8]
[8]
Source: TradeNavigator
The size/height of the reversal bar is encouraging, but again, look at the bigger picture here. The longer-term trend remains technically bearish.
The weekly chart of the S&P 500, however, shows us something else that's very important even if not obvious. That's the volatility index, or VIX. It kissed a technical ceiling around 38.0 last week, and promptly peeled back. To the extent the VIX is a better barometer of investors' psyches than the S&P 500 itself is, perhaps the bulls have drawn a line in the sand.
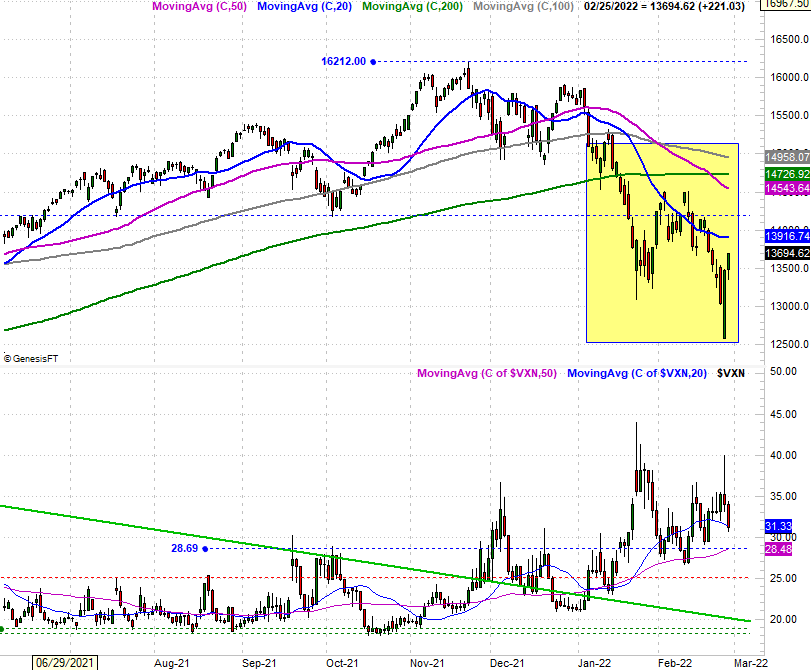
The same exact analysis applies to the Nasdaq Composite, and its volatility index, the VXN. That is, things got hairy and scary by early Thursday, yet by late Thursday the buyers were insatiable. Yet, even with the big rebound, the Nasdaq remains below all of its key moving average lines. This bullishness has yet to actually clear any meaningful hurdles.
NASDAQ Composite Daily Chart, with VXN
 [9]
[9]
Source: TradeNavigator
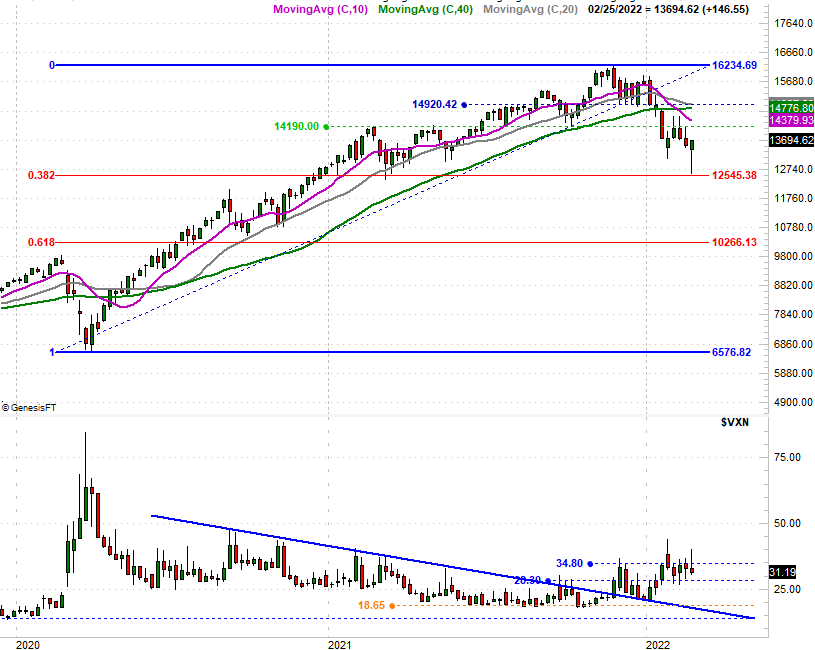
Here's the weekly chart of the composite, for a little added perspective. With a passing glance it looks like the index just made a major bottom, while the VXN has started to roll over. A longer, closer look though, actually says the VXN is now merely range-bound and the composite itself may only be in the throes of what will only end up being a short-lived dead-cat bounce.
NASDAQ Composite Daily Chart, with VXN
 [10]
[10]
Source: TradeNavigator
On the other hand, note that last week's low of 12,588 was almost a perfect kiss of the 38.2% Fibonacci retracement line… a retracement of the entire rally from the early-2020 low linked to the pandemic arriving in the United States. If the market was going to start a more permanent reversal, this is when and where it would have the best shot at setting that into motion. The psychological aspects of Fibonacci lines say investors have seen enough downside, and are now ready to start buying in earnest again.
This is a tricky time. The smart move for right now is simply doing nothing and waiting to see how this all shakes out. While it's tempting to assume the undertow is bullish enough to keep going (and that may well be how things unfurl) based on last week's strength, this rally hasn't passed any real tests yet. It will take a few days — at least — for that to happen if that's what's in the cards.