That. Was. Crazy. Even with Friday's partial rebound effort, last week was the worst week for stocks since 2008, when the fallout from the subprime mortgage crisis was in full swing. All told, the S&P 500 ended last week down 11.2%. From the previous week's peak to last week's low, the S&P 500 has been down as much as 15.7%. That qualifies as a correction that leads into a rebound. Whether or not we get that rebound now remains to be seen, and depends on several things.
We'll look at the odds of both prospects below. First, let's recap last week's major economic announcements, and preview what's in the cards for this week.
Economic Data Analysis
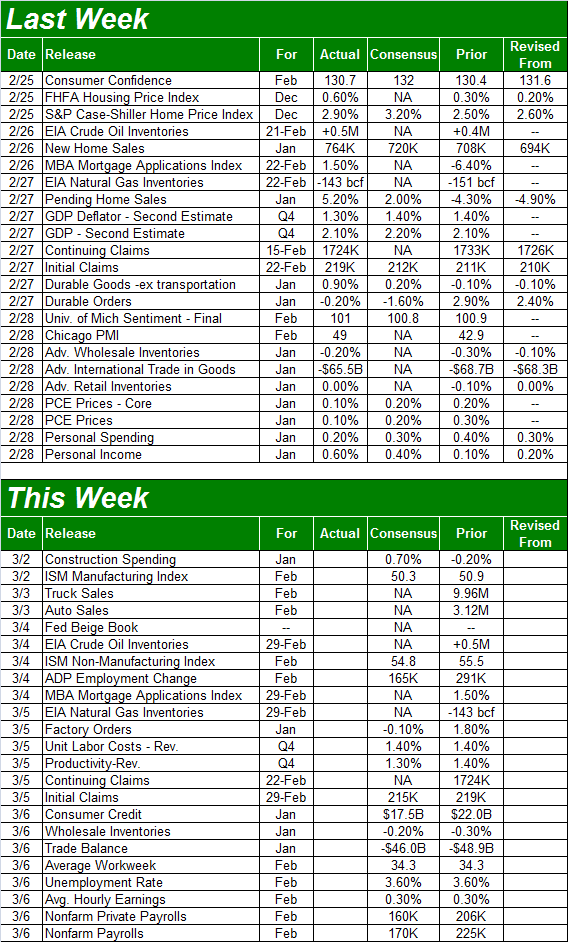
It was a busy week in terms of economic announcements, although little of it was terribly important. That's perhaps for the best though, as the news would have been lost in the noise of the market meltdown.
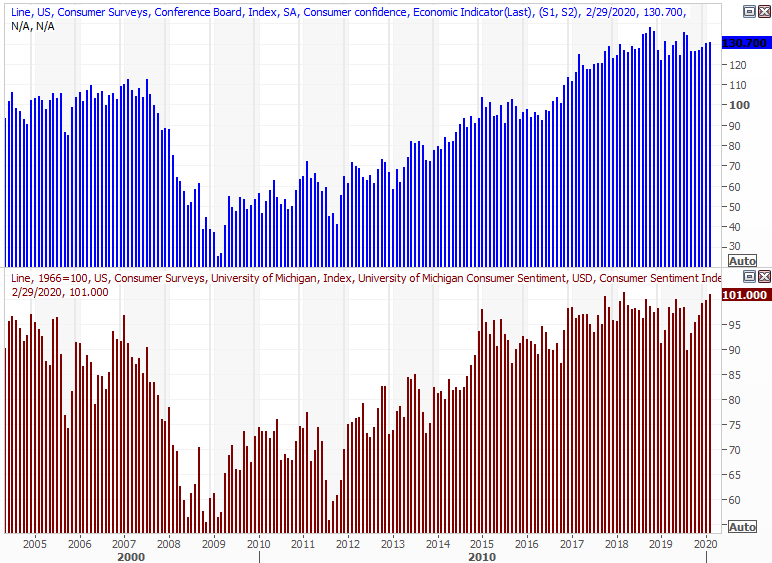
Perhaps most important last week was the updated look at the average consumer's feeling on what the future holds. The one and only consumer sentiment measure from the Conference Board edged up just a bit in February, while the third and final calculation of the Michigan Sentiment Index says consumers were considerably more confident than they were just a month earlier. In fact, the Michigan Sentiment Index's value of 101.0 as of last month is within sight of the multi-year peak of 101.4 from early 2018. Despite all the pitfalls and the prospective fallout of the coronavirus, consumers feel good.
Consumer Confidence Charts
 [1]
[1]
Source: Thomson Reuters Eikon
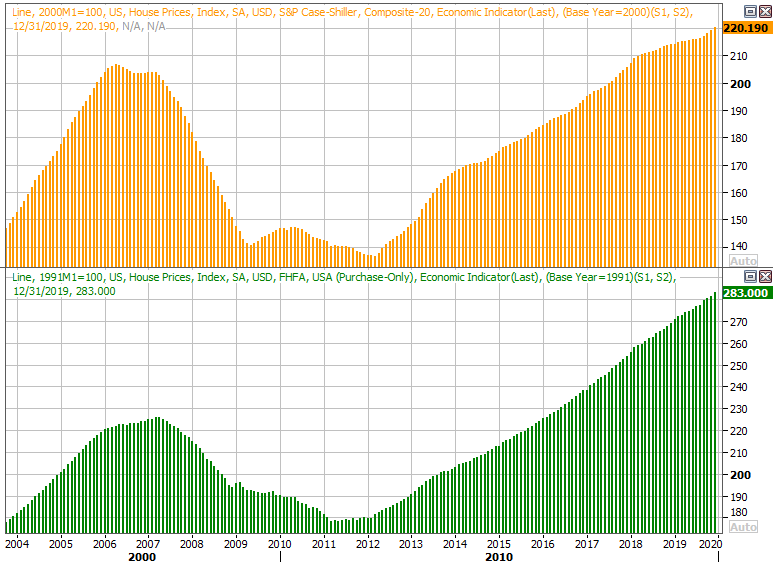
It was also a big week for real estate. Although the data is now a couple of months old, home prices — as measured by Standard & Poor's as well as the FHFA — each continue to march into record high territory.
Home Price Charts
 [2]
[2]
Source: Thomson Reuters Eikon
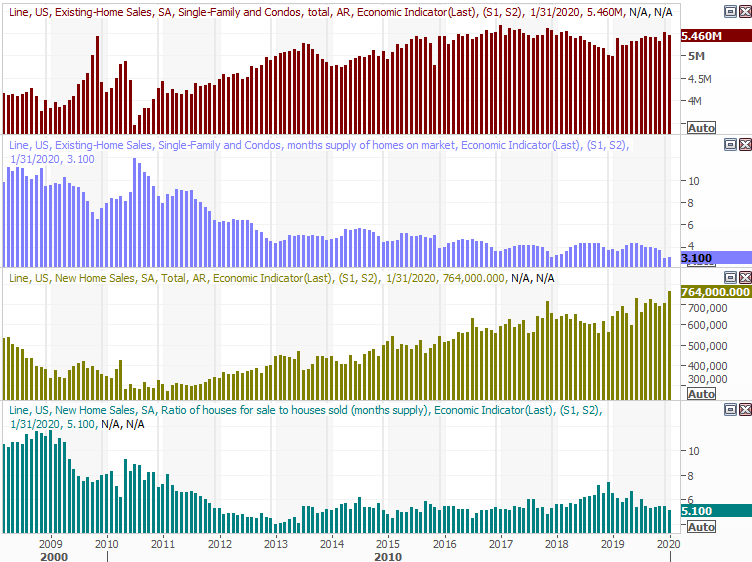
In the same real estate vein, sales of new homes jumped even more than expected in January, reaching a multi-year high pace of 764,000 units per year. That surge wasn't matched by a similar surge in sales of existing homes, but both are still growing. Also note that inventories remain suppressed. That may be holding home buying back… at least a little.
New, Existing Home Sales Charts
 [3]
[3]
Source: Thomson Reuters Eikon
Everything else is on the grid.
Economic Calendar
 [4]
[4]
Source: Briefing.com
This week's got about as much in store, with a handful of hard hitting ones on the dance card.
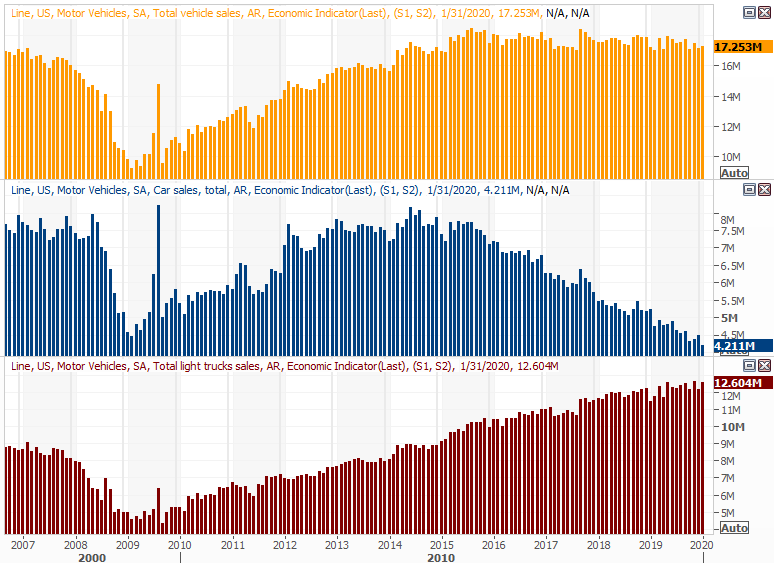
The party gets going in earnest early in the week, with auto sales figures starting to pour in on Monday. We won't get the finalized full numbers until Tuesday, but know right now that the overall trend is tilted slightly downward. Trucks and SUVs are no longer able to offset the incredible growing disinterest in passenger sedans.
Automobile Sales Charts
 [5]
[5]
Source: Thomson Reuters Eikon
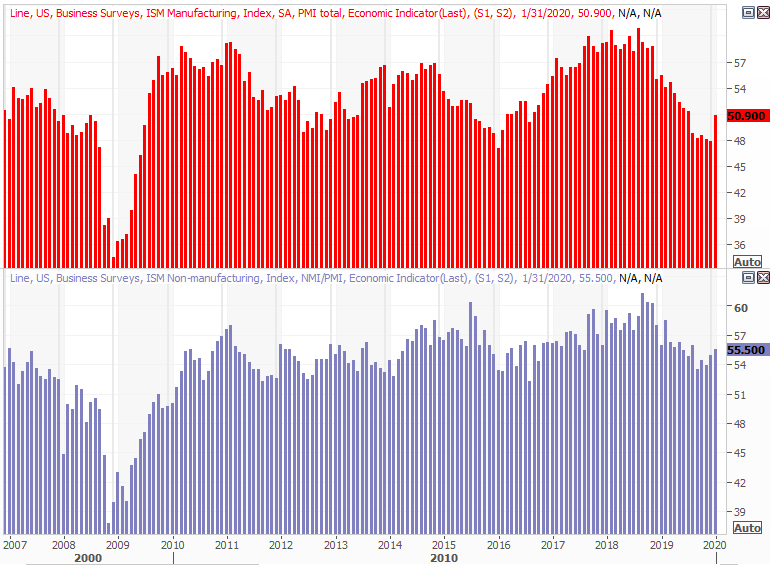
We'll also get February's ISM figures this week. You'll recall January's ISM report jolted higher, breaking a shallow losing streak. The services reading has also been advancing after ending last year on a low note. One good month doesn't make a trend, and in both cases the pros are saying the figures are going to drop just a little. If either or both actually improve though, it could readily light a fire under any rebound effort for the market.
ISM Index Charts
 [6]
[6]
Source: Thomson Reuters Eikon
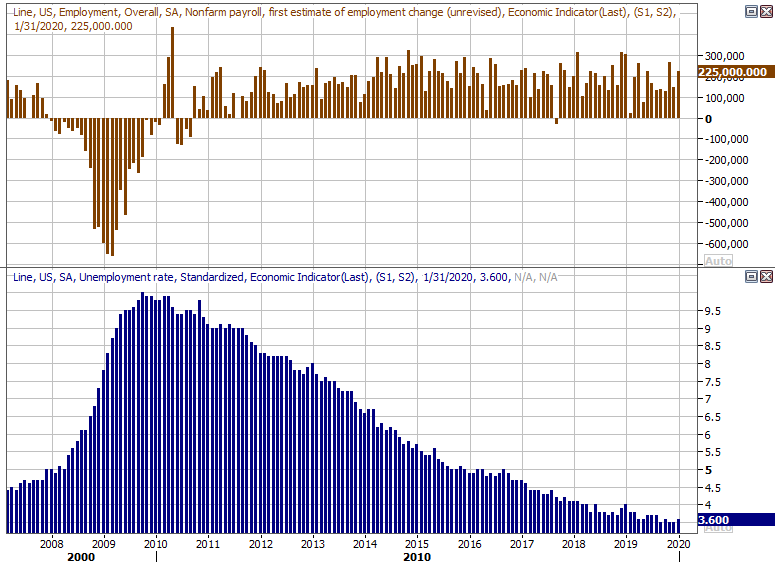
This week's biggie, of course, is going to be Friday's jobs report. We saw a bit of a headwind in January on this front, though most of that was due to the flood of people wanting to get into the jobs market for the first time (or for the first time in a long time). Job growth is expected to slow down, though not so much that the unemployment rate is expected to tick higher from January's still-very-low reading of 3.6%.
Payroll Growth, Unemployment Rate Charts
 [7]
[7]
Source: Thomson Reuters Eikon
As always, we'll have a more detailed look at the jobs figures — the ones you hear little about — at the website after Friday morning.
Stock Market Index Analysis
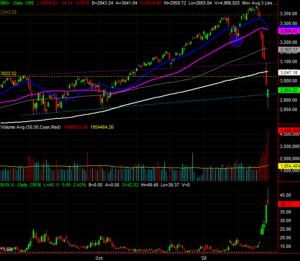
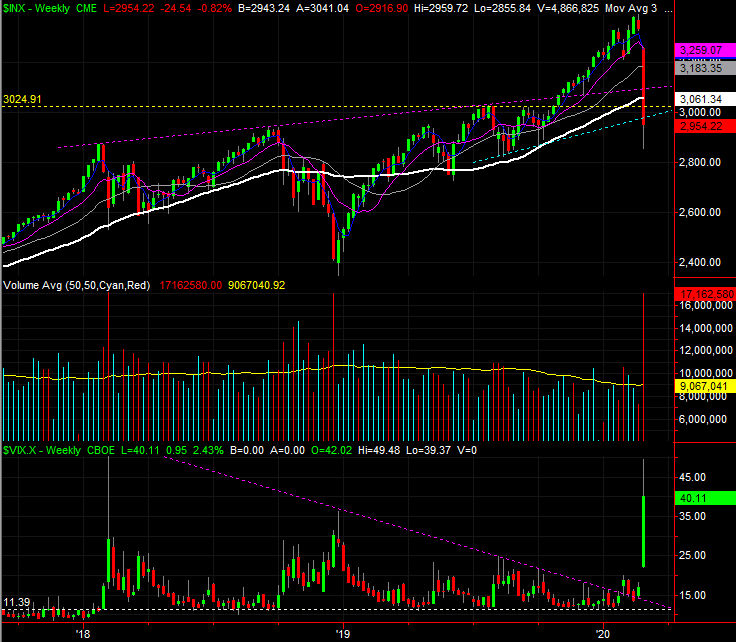
Let's start this week with a look at the weekly chart, just to paint the full, crazy picture. The plunge was abnormally-sized, dragging the index below any prospective vestige of support.
S&P 500 Weekly Chart, with VIX and Volume
 [8]
[8]
Source: TradeStation
Under normal circumstances this would flag more downside. These are anything but normal circumstances though. These are crazy times, and more often than not of late, extreme selloffs have been met quickly with similarly extreme bouncebacks.
In that vein, take note of two big pieces of information on the weekly chart. One is, the VIX raced to a multi-month high of 49.5 last week. When it spikes like that, it usually does so at a trade-worthy bottom.
The other interesting detail about last week… volume spiked too. Volume surges have also coincided with big volume surges. It usually indicates all the prospective sellers were flushed out, in a hurry.
The daily chart offers a couple bullish clues of its own. First and foremost is the shape of Friday's bar. It's a 'hammer' (in candlestick parlance), though the pattern goes by a couple of other names. The underpinnings are the same either way though. That is, the last of the would-be sellers were flushed out on Friday afternoon, then with no one left who was willing to put up a fight — and with bargain hunters finally ready to nibble — the tide turned in a matter of minutes. Such decisive, sweeping intraday reversals tend to mean something.
S&P 500 Daily Chart, with VIX and Volume
 [9]
[9]
Source: TradeStation
Fanning those possibly-bullish flames are now three different bearish gaps, the last of which is still in place from Friday's lower open. The market doesn't like to leave gaps unfilled.
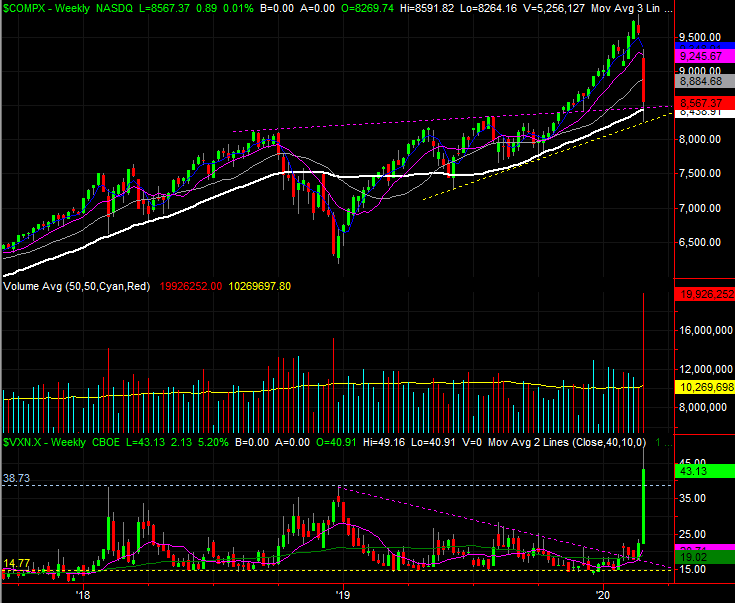
The same basic analysis applies to the NASDAQ Composite, but with a couple extra bullish nuances.
One of those nuances is the way the composite reversed its selloff right around the time it bumped into the 200-day moving average line plotted in white on the weekly chart below. More important, notice how often the same long-term moving average line has been a technical floor before (with the one exception of late-2018).
NASDAQ Composite Weekly Chart, with VXN and Volume
 [10]
[10]
Source: TradeStation
The stage may be set for a bounce, but the reversal effort so far is fragile. It could look as if stocks are going to continue rallying from here, but that may not be a move meant to last. The indices have a lot of technical ceilings — lines that used to be support — to get the advance going in earnest again. Conversely, should any advance effort peter out and we end up making lower lows, that may well spook another new batch of sellers into action.
The hard part is not flinching, especially when it looks like you're missing opportunities. Just stay disciplined. Don't force things.