– 'I can only show you the door. You are the one that has to walk through it' –
By Shawn Langlois, MarketWatch [1]
It's all about supply and demand.
Nick Maggiulli, analytics manager at Ritholtz Wealth Management and the man behind the "Of Dollars and Data" blog, says it might very well sound far-fetched, but one of the best predictors of future stock-market returns boils down to perhaps the most fundamental concept of economics.
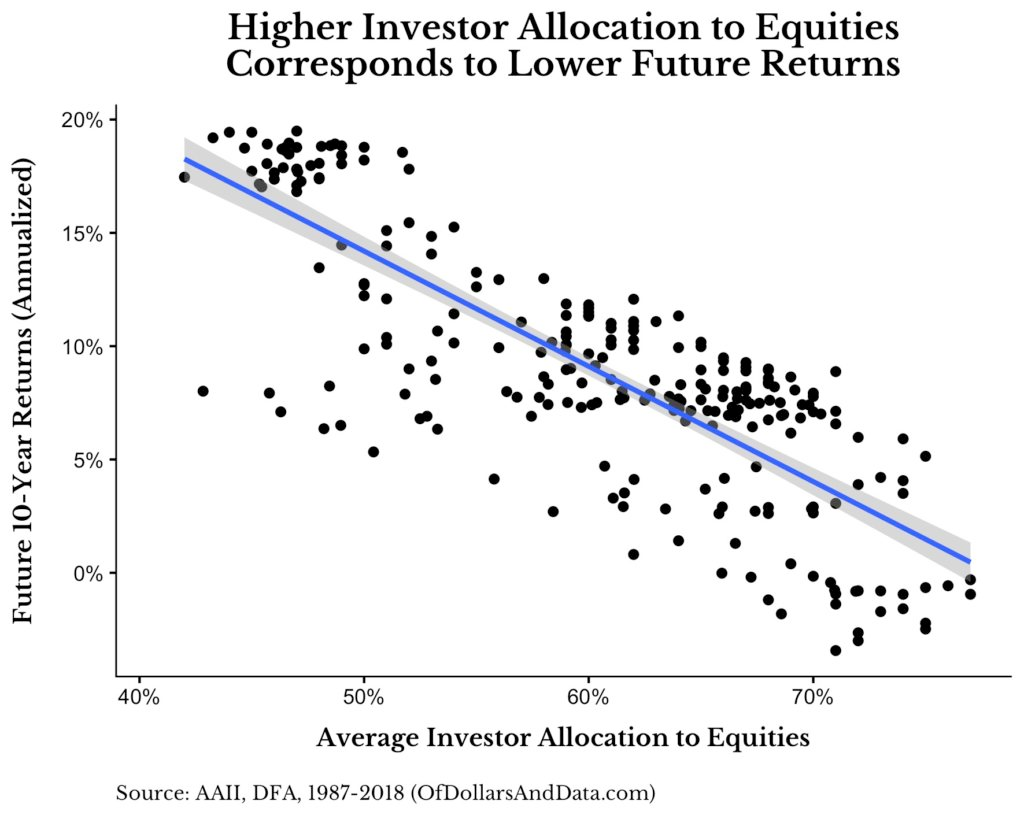
Basically, as it applies to investing, when average investor allocation to stocks is high, returns for the next 10 years tend to be low, and when average investor allocation is low, the opposite is true.
This chart lays it out nicely:
 [2]
[2]
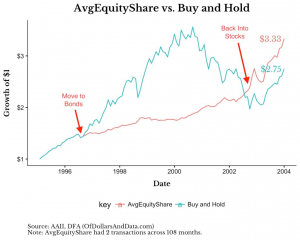
To tap into that trend, Maggiulli laid out this formula: When demand gets too high (greater than 70% average equity allocation), it's time to sell your stocks and move into bonds. When average equity allocation dips below 50% (demand is low), then sell your bonds and buy back into stocks.
That model run from 1987 to 2018 would have turned $1 into $43, with a far better drawdown profile than the typical "buy and hold" approach, which would have delivered a relatively paltry $24, according to Maggiulli's calculations.
The catch, however, is how virtually impossible it would have been to sit back and rely on that strategy while the stock market churned out such massive gains, as this chart clearly illustrates.
 [3]
[3]
"Can you imagine how hard it would be to sit in bonds for 4 years while your friends (some of them dumber than you) got rich along the way?" Maggiulli wrote. "It would be near impossible."
He explained the same thing happened during the financial crisis, when this model signaled sell in May 2006 and buy back in November 2008. "Yes, this also outperformed 'buy and hold' over that period, but who could've waited it out?"
This prompts the question: Where is that indicator now?
According to the model, you should've sold out of stocks in January after being fully invested every single month since November. The number is now hovering around the 70% level, so the 50% signal to buy back is a long ways away.
"Does this mean that a crash is coming? Maybe. Or maybe in a few years. Or maybe the model doesn't hold anymore," Maggiulli wrote. "I can only show you the door. You are the one that has to walk through it."
At last check, the Dow Jones Industrial Average was down fractionally at 26,468.
From MarketWatch [1]