The market may haves pushed a little deeper into record-high territory on Thursday, but once again, the higher it goes the weaker it gets. Participation in the bullish effort is fading fast, even if that doesn't appear to be the case with just a quick, first glance.
Thursday's 0.27% gain from the S&P 500 may have been off the intraday high, but it's still a gain, and the index is still up nearly 7% from its early October low. That's enough to drag the market a bit deeper into record high territory. Investors were glad to celebrate the (apparent) cooling of the trade war that's largely been fought with tariffs.
Not unlike the past few peaks for the broad market though, this one is tainted by a suspicious bowing out of some – though not all – bulls.
Evidence for the claim comes in two forms. The first and arguably most alarming is the fact that while the market's been gaining, it's done so with fewer and fewer winners. The NYSE's daily decliners ($DECL) has hovered between 1500 and 1600 for the past three trading days, while the NYSE's daily advancers ($ADV) has struggled to hold above 1300. In fact, though the market's up for the past month, the NYSE's advancer trend has been pointed lower for a couple of weeks now, while its decline trend has been growing for the same period.
 [1]
[1]
The same can't quite be said for the NYSE's daily up and down volume. That is, the exchanges daily bearish volume ($DVOL) remains lower than its daily bullish volume ($UVOL). Even then though, it's becoming fairly clear that the daily down volume is starting to edge upward, while the daily up volume is mostly stagnant.
It's an important, even if not earth-shattering, nuance. Most market trends tend to reflect the underlying breadth and depth, yet trends also tend to take a turn after breadth and depth trends do. If the read on the lack of advancers and the lack of bullish volume is right, the rally is running on empty.
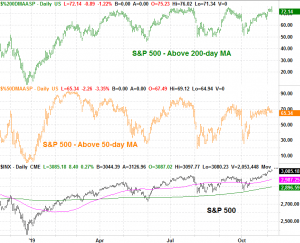
The second piece of evidence that this marketwide rally isn't quite as firm as many are hoping is provided by the semi-related measure of how many of the NYSE's stocks are above their 50-day and 200-day moving average lines.
Moving average lines are of course a simple but effective way to spot when trends are taking shape, and when they've been decidedly snapped. Theoretically, most of an index's tickers would be above their 50-day moving average line with the intermediate-term undertow was truly bullish. Likewise, a healthy long-term uptrend would be marked by most of an index's stocks being above their 200-day moving average. We do have that in both cases right now. That is, 72.1% of the S&P 500's constituents are above their 200-day moving average line, while 65.3% of the index's holdings are above the 50-day line. But, in both cases, those percentages are now inching lower.
 [2]
[2]
There are other red flags too. Those include a VIX that's too low, a put/call ratio that's quickly becoming too low for its own good, and an Arms Index (or TRIN Index) that's also falling to levels often seen at a fairly major market top. It would also be short-sighted to say the market doesn't look and feel overextended thanks to this year's incredible 28% rally.
Those are hints of a contrarian nature though, and subject to interpretation. The hints above aren't really up for debate as to their meaning, even if they're not overwhelmingly conclusive.
Whatever the case, this is at least a subtle hint that not everything is as hunky-dory as it may seem on the surface. The rally needs some help, or otherwise runs the risk of crumbling.