With nothing more than a quick glance at Tuesday's modest loss, it would be easy to assume we just hit a patch of turbulence. Stocks are more or less where they were a week ago, and the S&P 500 seems to be recovering well from intraday setbacks; Tuesday was an exception.
Things aren't quite as healthy as they may seem on the surface though, for a couple of different reasons.
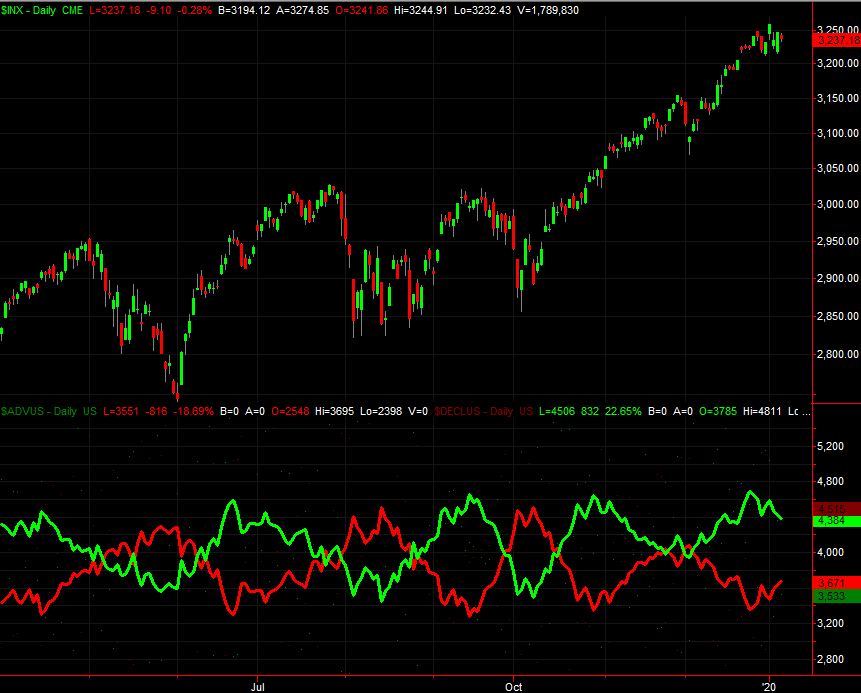
One of those reasons is fading bullish volume and waning daily advancers. The raw daily measures of each are too erratic to interpret, but we can smooth the daily data out pretty nicely just by looking at near-term moving averages of the data. Trends become pretty clear then. That's what the chart below shows us, comparing the S&P 500 to the moving average of the NYSE's daily advancers in green, and the NYSE's daily decliners, in red. The breaking point comes when the red line at the bottom of the graph overtakes the green line. We're not there yet, but we're clearly moving in that direction.
 [1]
[1]
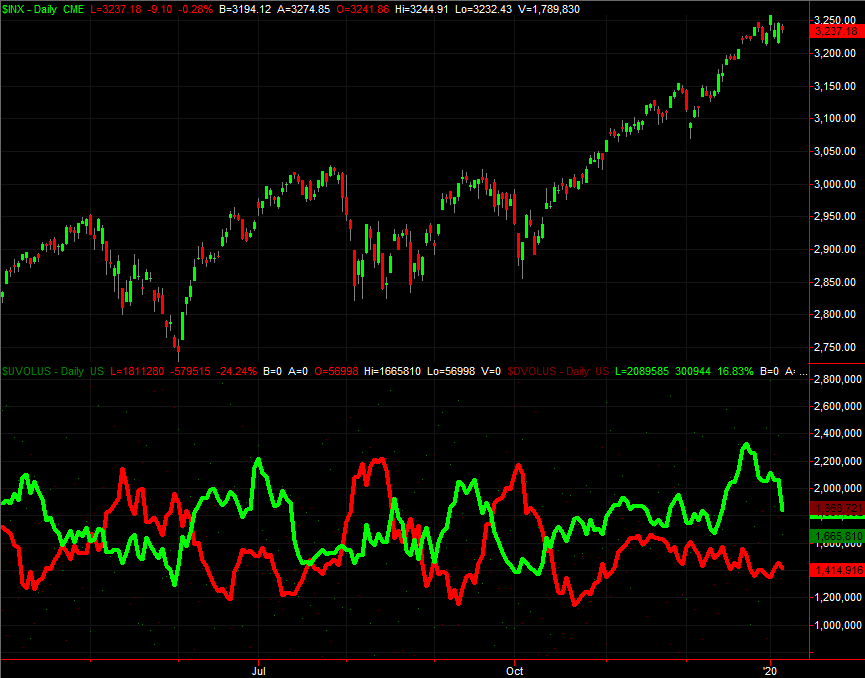
In a similar vein, the chart below compares the S&P 500 to a short-term moving average of the NYSE's daily "up" volume in green, and its daily "down" volume in red. This data plot is a little less – ok, a lot less – inversely correlated. That's because the total net number of daily NYSE advancers and decliners doesn't change, while the daily buying or selling volume can vary greatly. Even so, there are discernible trends here, and like its counterpart above, crosses of the two lines tend to materialize at major turning points for the broad market. Bearish volume isn't swelling, but clearly the amount of bullish volume is falling fast.
 [2]
[2]
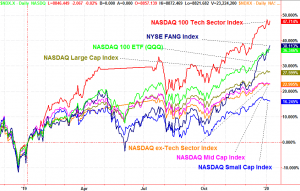
The other red flag quietly built into our current scenario? The strength we've seen of late, and the strength we're still more or less seeing now, isn't well balanced at all. A few high-profile stocks are doing ALL of the heavy lifting, while other names have actually already started to fade. Namely, the FANG stocks and the NASDAQ 100 Technology Sector – and there's a ton of overlap between the two – are the only groups still doing well, followed by the NASDAQ 100 Index. Again though, the NASDAQ 100 sports a lot of overlap with the NASDAQ 100 Tech Index and the FANG Index. Non-tech stocks in and not in the NASDAQ are fading for the past few days, and small caps are already peeling back from last week's peak. Mid caps are lethargic too, and for that matter, all NASDAQ large caps as a group have struggled since late last week, and that grouping still includes the big tech and FANG names doing so well.
 [3]
[3]
It's only anecdotal evidence of weakness thus far, but noteworthy details all the same. The market never gives a clear "buy" or "sell" signal. Indeed, the market has a way of veiling and obscuring clues to keep you guessing as much as possible. It's also possible the market may find a firm footing again, and move higher without moving lower first.
It would be naive not to at least respect the red flags starting to wave though, if only to see if the prospective sell signals turn into more.