
If a trader wasn't explicitly looking for it, he or she might not even notice. To those who make a point of watching though, there it is. After nearly eight months of underperformance, the nation's listed small cap stocks are starting to outperform their large cap counterparts. It's a sign that investors are feeling considerably more confident than they have been since early in the year, willing to take more chances on less-proven names.
The charts below tell the tale. They're both the same concept, more or less, but with two different start dates.
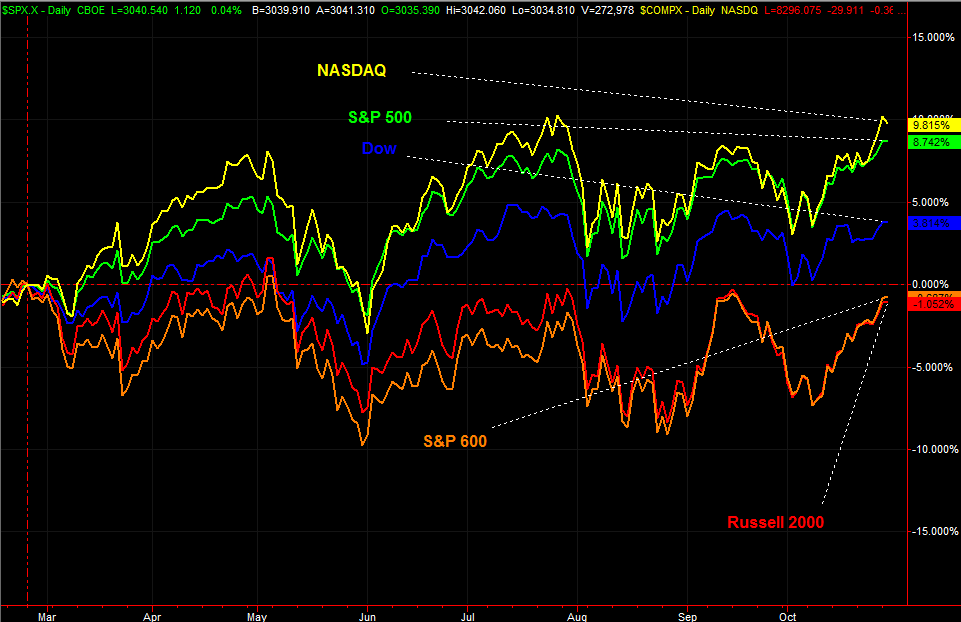
The first is a comparison of the NASDAQ Composite, the Dow, and S&P 500 – all large cap or predominantly large cap indices – along with small cap indices S&P 500 and the Russell 2000. Since the market peak in February, the composite is up nearly 10%, while the Russell 200 is down a percentage point; the S&P 600 is also in the red by 1%. The S&P 500 is ahead by nearly 9%, with the Dow in between with almost a 4% gain.
 [1]
[1]
It's a message. The message is, not even the stodgy blue chips are compelling enough for investors. Traders are looking for growth (particularly from tech names), and though the news-based backdrop has been grim, investors have actually responded with more aggressiveness with the most proven and notable names that might just have a shot at overcoming economic lethargy.
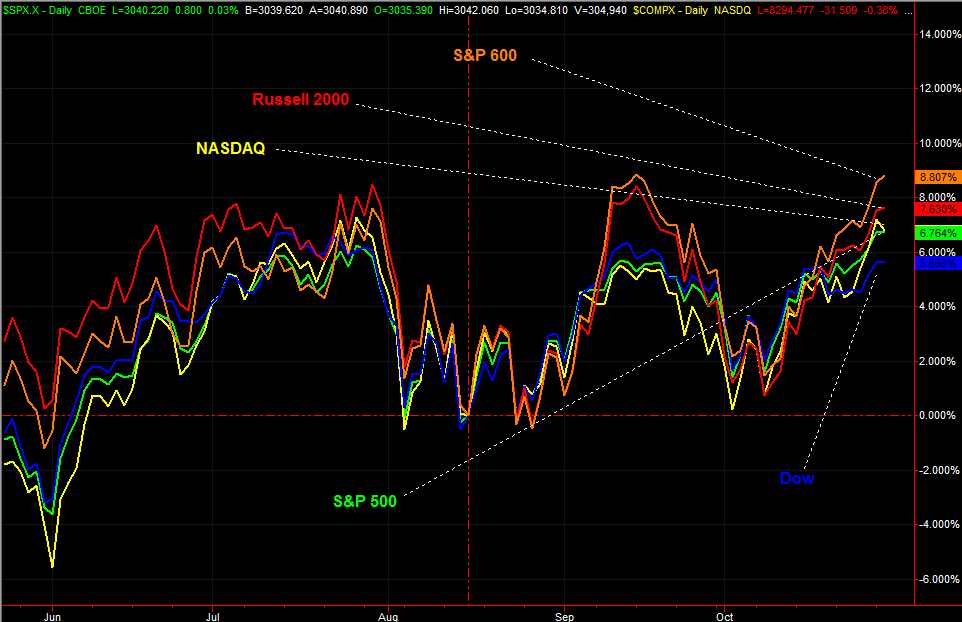
Here's the same performance-comparison chart since the market hit bottom in mid-August. (Yes, we've seen some sizeable setbacks in the meantime, but none of those lows were lower than the prior low.) From that point, the S&P 600 is in the lead with nearly a 9% gain, followed by the Russell 2000's 7.6% advance. The NASDAQ and the S&P 500 are both ahead by less than 7%, and the Dow is up just a little less than 6%.
 [2]
[2]
Also take note of the fact that this is the second time small caps have surged ahead. We saw the same thing happen in September, and though that rally was unwound, it reshaped the same way.
There are two interpretations of this scenario. One of them is the aforementioned premise that investors have found more confidence… confidence that was missing a few months ago when it felt like the trade war and political turmoil was going to become problematic. The other possibility is, it's all just a big coincidence, and that small caps have bounced better because they fell further. Of the two prospects though, it's the former that holds the most water. A few days' worth of outperformance can be chalked up to random volatility. This has become a weeks-long situation.
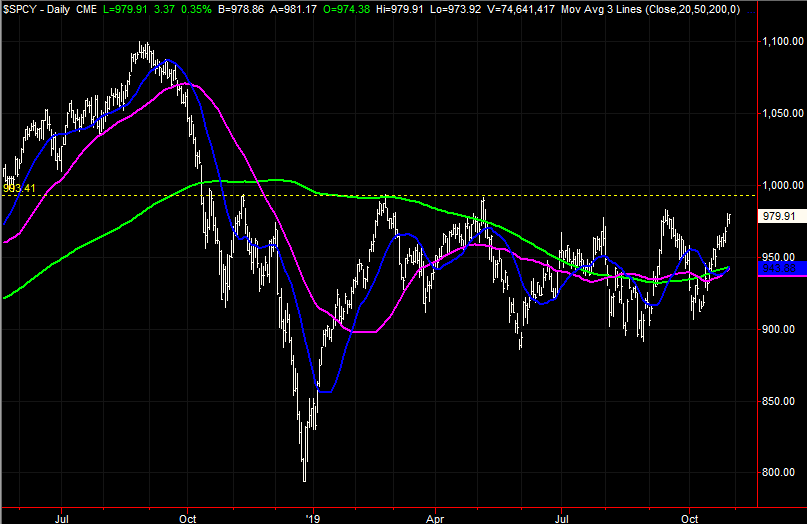
That being said, we're not quite over the proverbial hump just yet. The S&P 600 has one more ceiling to clear before we can say the green light has been fully given. That ceiling is 993, marked as a yellow dashed line on the daily chart. That's where the small cap index peaked three times since November of last year (and stopped peaking there in July). One or two more good days could get the index over the big hump.
 [3]
[3]
There's something else worth noting on the same daily chart of the S&P 600, however. The 50-day line (purple) is about to cross back above the 200-day moving average line (green)… a so-called 'golden cross' that portends more bullishness. Yes, the golden cross from August was to no avail, but the index was never really out of the hunt, so to speak.
Nothing is ever set in stone, particularly when it comes to the market. As always, don't take your eyes off of anything. All the same, not taking your eyes off of anything includes embracing what the chart of small caps and their relative performance are saying.
The most frustrating part of all about this information is that this is the time of year when it shouldn't be happening… at least not quite yet. But, that's another story.