
Editor's note: The first part of this two-part commentary from Chris Vermeulen can be found here [1].
——————————————————————————————-
Now, we are ready to share some new research that will help all of us understand the current and future market conditions given the ratios of the capital markets to GDP as represented by the charts above. The research team at www.TheTechnicalTraders.com [2] believe we have identified a means of structurally understanding the US capital markets in relation to risks or reversal and crisis contagion. As the Buffet Indicator is now warning that the US capital market may be nearing a critical price top, we can now attempt to put this data into perspective in relation to capital flows and capabilities. Yes, in terms of historical price appreciation, we are now at or near levels that have historically been associated market tops and price collapses. Let's look at how the Buffet Indicator has reacted at times using our new Custom Market Cap Volatility Index.
 [3]
[3]
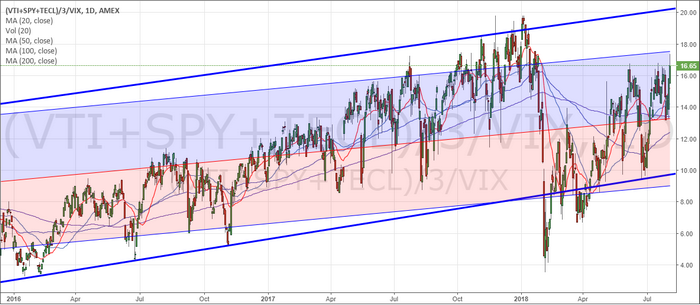
This Daily Custom Market Cap Volatility Index shows data from 2016 until now. It clearly shows the deeper price rotation near the elections in 2016 and the deep price rotation in February 2018. Let's compare these levels to the Buffet Indicator reactions. In 2016, the Buffet Indicator fell nearly 15% as the US stock market indexes fell 13.5%. In February 2018, the Buffet Indicator fell nearly 8.5% as the US stock market fell 11.88%. Our Custom Market Cap Volatility index operates as a range of price rotation that assists us in determining if and when the price is outside normal price ranges. We are attempting to map price appreciation in relation to volatility in a historical form. When price retraces or contracts, volatility spikes higher. With this process of volatility increasing and price decreasing, the increased VIX levels will show up as very deep Custom Market Cap Volatility price corrections. The VIX will increase much faster than price will collapse, thus any price collapse will likely stay within these ranges, or fall outside these ranges if the price collapse is more extended.
Extended price collapses will result in much higher VIX levels while prices continue to decrease. If the price collapse is very aggressive, the increase in VIX will shoot higher and our Custom Market Cap Volatility Index will crash to very low levels. If the price collapse is an orderly price decline, then the VIX levels will increase as price decreases more gradually and the Custom Market Cap Index will likely stay within moderate ranges. At least we hope this works as we are suggesting. Let's take a look a longer-term data.
 [4]
[4]
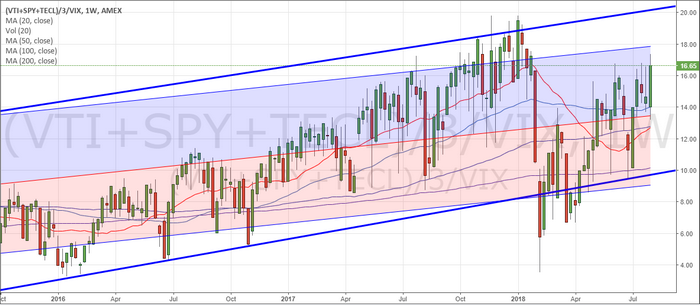
This Weekly Custom Market Cap Volatility Index shows the same date range as the previous Daily chart. We should be able to see the Blue channel levels that originate much earlier as normal price channel ranges. We have added a Std. Deviation channel to this chart originating from the 2010 lows that show the range as associated by the deviation ranges.
This data tells us that US stock market prices have recently rallied from near the middle of these historical channels and still has quite a bit of room to the upside. This would indicate to us that the US stock market is not overly priced and that capital is still working into the US stock market in ways that support further price appreciation. Once price reaches above the Std. Deviation channel and above our Blue price channel levels, then we would start to become concerned that prices may retrace as they did in February 2018.
Take a look at the rally from 2016 until now. Notice how the lows near 2016 represented a relatively depressed price channel range with our Custom Market Cap Volatility Index. In other words, prices were hovering near the lower channels with no real signs of risk as prices did not collapse below these levels. One correlation we can make with the Buffet Indicator that may become evident in our Custom Market Cap Volatility Index is that as US Bond rates increase, capital is usually moving away from the stock market and into Treasuries. When we consider the past actions of the US Fed and the correlations of the Buffet Indicator to these central bank actions – we might find a direct correlation.
Yet we believe our Custom Market Cap Volatility Index is valuable for a number of reasons; first, we can use this index as a measure of price rotation and standard deviation low price identification. This will allow us to determine when prices are poised to form a bottom setup and when an opportunity exists for upside price acceleration. Second, we can identify when prices are nearing the upper channel as an early warning that prices may be attempting to hammer out a longer-term top formation – allowing us to reduce risk and scale back our positions. Lastly, we can look for cycles that may help us determine key dates for price rotation.
 [5]
[5]
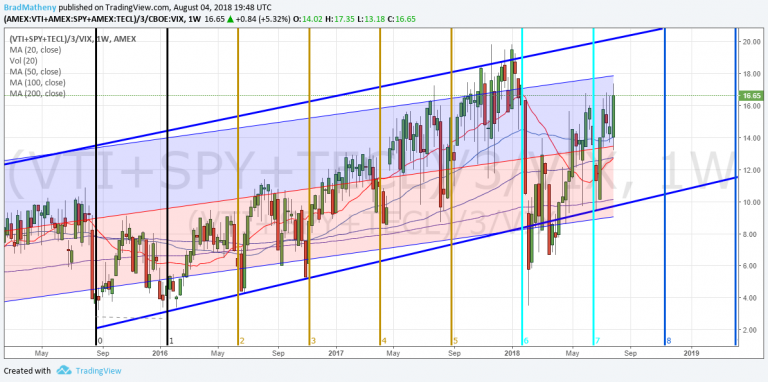
This cycle chart highlights the deeper low price rotations in our Custom Market Cap Volatility Index. These low points are when the US stock market has seen increases in volatility and moderately deep or deep price corrections. Notice how the early 2018 price collapse is clearly shown as a very deep price rotation in our Custom Market Cap Volatility Index. Notice how the 2016 and 2017 deeper price rotation on the Custom Market Cap Volatility Index correlate with price rotation in the US major indexes. Also, pay attention to the price appreciation that took place after these deeper price corrections.
These cycles suggest that the US stock market should continue to push higher for at least the next 90+ days till near November 2018. Near this date, there is a relatively strong likelihood that some type of deeper price correction will hit the US markets – possibly a bit sooner or after this date. The cycle frequency and accuracy of these bottoms suggest that the price of the US stock market will likely push higher over the next 30+ days – then possibly stall while attempting to form a potential top. It is likely that this top formation or horizontal price range will become extended consolidation before any deeper price correction begins. In the meantime, we believe the US stock market will continue to push higher as our Custom Market Cap Volatility Index shows.
Our suggestion at this point is that the Buffet Indicator is failing to correlate the global capital pool that exists currently and is also failing to adequately reflect the capital migration that is currently taking place throughout the globe. We believe the US stock market could continue much higher at this point, depending on how the global markets react to this shift in capital and the longer term debt issues that are playing out. We certainly don't want to mislead anyone – so we are alerting you that November or December of 2018 appears to be a time where prices may rotate a bit more violently to the downside. This may be correlated to some type of global crisis event or it could be an extended capital shift away from the US stock market where capital flees to new opportunities in other global markets. All we know right now is that the US stock market is still on a path to move higher and we still have quite a bit of room for market cap growth over the next 3+ months.
If you want to know how our other proprietary price modeling systems and indicators help us keep our valued members and subscribers informed of future market moves, then visit www.TheTechnicalTraders.com [2] to learn how we can help you find and execute better trading decisions with our specialized research, daily video updates, detailed trading signals and more. Don't let the other news fool you with generic content and comments – true researchers pull from resources or create new resources to give them a much clearer understanding of the market dynamics ahead. Get ready for further upside prices and watch for an end of year price rotation that could be dramatic.
53 years experience in researching and trading makes analyzing the complex and ever-changing financial markets a natural process. We have a simple and highly effective way to provide our customers with the most convenient, accurate, and timely market forecasts available today. Our stock and ETF trading alerts [6] are readily available through our exclusive membership service via email and SMS text. Our newsletter, Technical Trading Mastery book [7], and 3 Hour Trading Video Course [8] are designed for both traders and investors. Also, some of our strategies have been fully automated for the ultimate trading experience.