By Bret Kenwell, TheStreet.com [1]
Netflix (NFLX [2]) – Get Report [3] continues its blistering run, with shares rallying 5.3% at one point Thursday and hitting a new all-time high of $449.52.
It’s not the only FAANG stock with momentum, with Amazon.com (AMZN [4]) – Get Report [5] also hitting a record high on Thursday [6], although Netflix remains the best-performing stock of the group this year.
Driving shares higher is a combination of investors realizing just how strong streaming video is right now – which also includes Disney+ (DIS [7]) – Get Report [8] and Roku (ROKU [9]) – Get Report [10] – and momentum traders bidding the stock higher.
As inspiring as this rally has been, investors are likely better off trimming some profit to lock in gains rather than initiate a new position. Let’s take a look at the charts to get a better idea of what the technicals say of Netflix.
Amazon and Disney are holdings in Jim Cramer's Action Alerts PLUS member club [11]. Want to be alerted before Jim Cramer buys or sells AMZN or DIS? Learn more now. [11]
Trading Netflix Stock
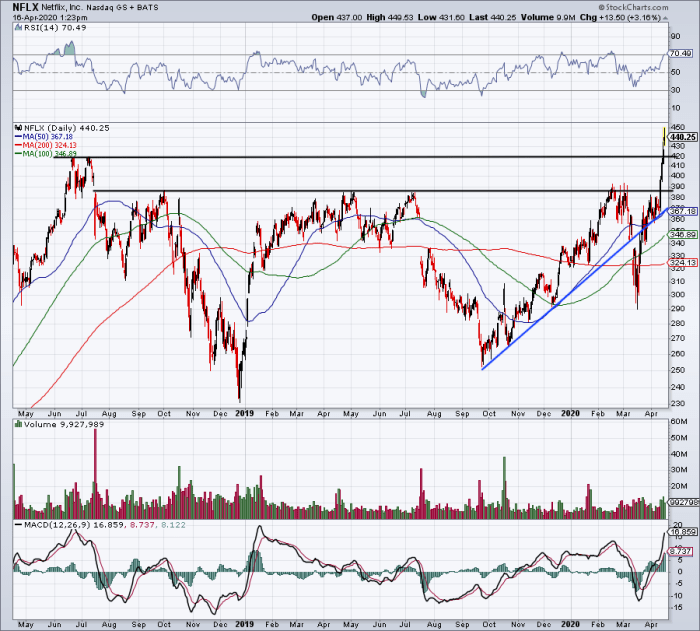
Daily chart of Netflix stock.
Chart courtesy of Stockcharts.com
In a perfect world, trading Netflix stock would be a piece of cake. Unfortunately, rarely is it that easy. A few days ago on Monday, Netflix stock burst through multi-year resistance at $380. This is something investors should have had on their radar [12]. On Wednesday, the stock pushed higher to new all-time highs and then did so again on Thursday. Not many were looking for this big of a move so quickly.
Netflix is scheduled to report earnings on April 21st [13]. Most investors think of earnings as the big catalyst – and it is, for both directions – but the stock can act funky ahead of the print too.
In other words, we could get a pullback in Netflix as investors take profits ahead of what could be a volatile event or they may continue to bid Netflix higher into the report in anticipation of strong results.
Whether the stock pulls back after earnings or before (or at all), I want to look at some of the potential downside levels. Specifically, I want to see how Netflix stock trades on a pullback to the former highs near $420. If this level gives the stock a bounce, $450 is back in play.
If a pullback to $420 materializes and support doesn’t hold, it puts prior range resistance on the table near $380. Given how powerful the breakout was over this mark and how long it was resistance, I would expect it to act as support upon its first test. Just below that is the 50-day moving average and uptrend support (blue line).
Is this a guarantee that Netflix will pull back? Of course not. But I would expect the stock to cool off a bit, either ahead of or after earnings.
From TheStreet.com [1]