
— Bank earnings continue to roll in, with Goldman Sachs and Morgan Stanley both reporting. Here's how the two stocks look on the charts. —
By Bret Kenwell, TheStreet.com [1]
The banks kicked off earnings season on Friday, as the country's largest investment banks began reporting their fourth-quarter results.
We went over the most notable setups, knowing full well that we would also need to hear from Goldman Sachs (GS) and Morgan Stanley (MS), which both reported on Tuesday before the open.
For its part, Goldman Sachs delivered a top- and bottom-line miss. The shares opened about 2.5% lower and are now down about 5%.
Morgan Stanley delivered in-line earnings results, while revenue of $12.7 billion came in $100 million ahead of consensus estimates. In reaction to those results, the shares at last check were up more than 6% and the stock is hitting its highest levels since February.
Trading Goldman Sachs on Earnings
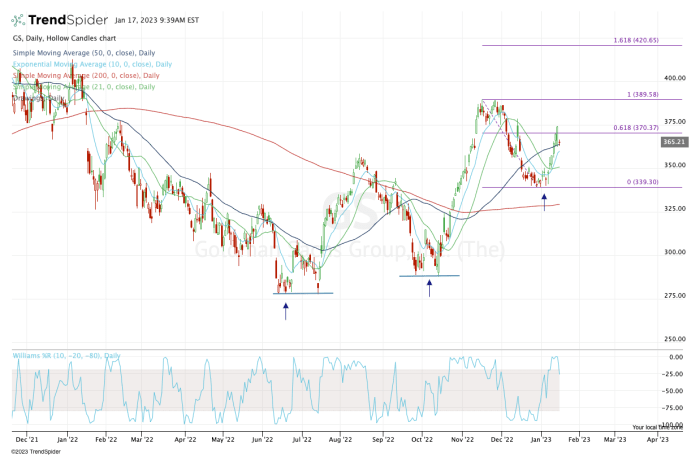
Daily chart of Goldman Sachs stock
 [2]
[2]
Chart courtesy of TrendSpider.com
Goldman Sachs stock put in a nice double-bottom over the summer, then again in the fourth quarter. Each time, the shares pulled back, Goldman Sachs made a higher low and found a way to push to new recent highs.
Today's post-earnings reaction is mild, particularly after a six-day 9.8% rally. Ideally, support near the 10-day and 50-day moving averages would have held for bulls.
So far, though, it isn't, so $350 and the 21-day are the next level of support.
On the long side, let's see if Goldman Sachs stock can hold $350, then reclaim the 10-day and 50-day moving averages. If it can, bulls will want to see it regain the 61.8% near $370, then rotate over last week's high near $375. Above $378 puts $390 in play.
If $350 fails as support, it opens the door back down to prior range support around $340, while a close below this level would be quite destructive for the charts.
Trading Morgan Stanley on Earnings
Daily chart of Morgan Stanley stock
 [3]
[3]
Chart courtesy of TrendSpider.com
As for Morgan Stanley stock, the shares are trading much better this morning. The stock is clearing the fourth-quarter and December high, as well as the 61.8% retracement from the 52-week low up to the 52-week high.
Both measures come into play at just over $95.
From here, $100 is the next logical upside target, with the 78.6% only slightly beyond that figure at $101.76. Above that puts $105 resistance in play, then the highs near $110.
On the downside, it's simple: Bulls want to see Morgan Stanley stock hold $95.
From TheStreet.com [1]