— AMD stock is trying to rebound after a disastrous 2022 campaign. Here's how it can fly higher going into year-end. —
By Bret Kenwell, The Street.com [1]
Advanced Micro Devices (AMD) has not had an easy run this year, but like other technology and chip stocks, it has been finding its groove lately.
On Thursday, I looked at the improved trading from Nvidia (NVDA) and made a case for how it could rally higher if it were to clear a key resistance level. We have a similar situation with AMD.
The company was eating Intel's (INTC) lunch, while avoiding some of the demand problems we were seeing with Nvidia. That's why for most of this year, AMD was outperforming both of its peers.
Then it reported preliminary results on Oct. 7, which crushed the stock by 14% and sent it to new 52-week lows.
The issues finally caught up with AMD and that was clear when the company reported earnings a few weeks later.
However, AMD stock didn't make new lows when it reported earnings and shares are now turning higher. Let's look at the charts.
Trading AMD Stock
Daily chart of AMD stock
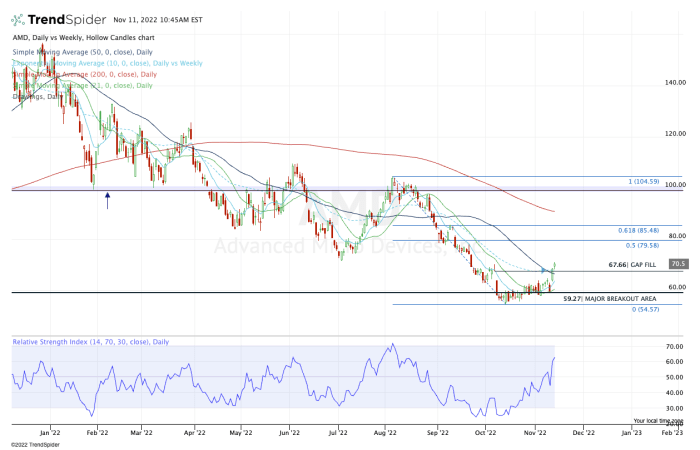 [2]
[2]
Chart courtesy of TrendSpider.com
The daily chart above highlights AMD stock clearing a number of key areas, including the gap-fill level at $67.66, as well as the 10-week and 50-day moving averages.
Now above its key short- and intermediate-term moving averages, AMD stock has some room to run if it can hold above these measures.
Or at least it appears that way.
There's a simple (but hard) truth when it comes to bear markets: After stocks bottom, they have layer after layer of potential resistance above them. Eventually the good stocks will tear these layers down, but it takes time.
Notice the attractive daily chart above, but the weekly chart below that suggests some caution.
Weekly chart of AMD stock
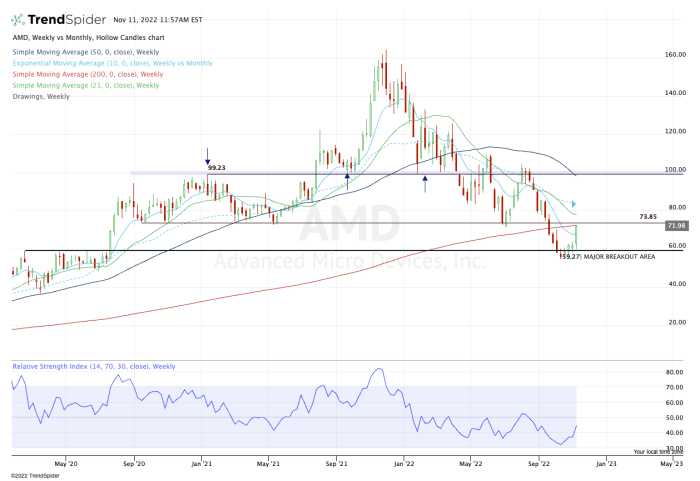 [3]
[3]
Chart courtesy of TrendSpider.com
The weekly chart shows AMD running right into the 200-week moving average and a huge level of prior support near $72 to $74.
That said, if the stock can push through that zone, one could make a compelling argument that AMD stock could run to the $80 to $85 area, where it finds its 50% and 61.8% retracements.
Above that would open the door to the 200-day moving average.
The charts do suggest this is a possible upside target for AMD stock, but it needs to get through a few overhead resistance levels on the weekly. Bulls may consider waiting for a small pullback – perhaps into the upper-$60s – before it gears up for a potential breakout.
From TheStreet.com [1]