It's not the first time, or even the fourth time, we've seen it within the past few months. What's that? A rally that gets off to a good start, but peters out before it gets going in earnest. In that each time we've seen it recently the rally fades though – at least to some degree – we can't ignore that it's happening again.
Yes, the pace of progress so far this week is slow that the pace we were seeing over the course of the past two weeks. That's a red flag, though not in and of itself a reason to fret. A rising market is still a rising market, even if it's not rocketing higher. What's concerning here is why the momentum has already slowed. The buyers are backing off, acting as if they're not convinced stocks actually have any upside left to give.
There's more than a little bit of empirical evidence to make such a claim.
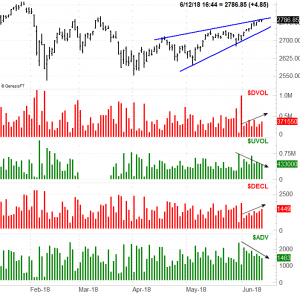
Regular readers of BigTrends commentary will likely recognize the graphic below. It's a plot of the S&P 500 compared to the NYSE's up and down volume data, and the NYSE's advancer and decliner data.
Generally speaking, a trend has to at least sustain volume and participation if it's to last, if not grow it. That is to say, the bullishness we saw over the course of the prior two weeks should have been made on steady volume and persistent daily advancers, if not a growing number of advancers and rising up volume. [Conversely, a bullish move for the market is matched by falling bearish volume and a shrinking number of decliners.]
That's not what we saw leading into Tuesday's action. Though the rally got off on the right foot on the first day of June, the number of advancers has been falling and the number of decliners has been rising the whole time. Likewise, the daily up volume data was been waning for a few days now, and the daily down volume has been toying with the idea of increasing.
 [1]
[1]
It's not the end of the world. There's still more bullish volume than bearish volume, and there are still more rising stocks than falling stocks. This is hardly the kind of undertow one would want to see if they were betting on bullishness though. This image indicates that the higher the market goes – and it's not exactly roaring – the less confident traders become in owning stocks.
This is only one piece of an intricate puzzle, though an important one. Each passing day that doesn't show more bullish breadth (advancers) and more bullish depth (volume) brings us one day closer to a corrective move that forms when the last of the would-be buyers are flushed out and the sellers take over.
Something else to watch on the daily chart of the S&P 500: It's now at the upper edge of a converging wedge pattern (framed in blue).
This could be a bullish catalyst. If the index breaks above that technical ceiling, it could induce the very bullish breadth and depth we're saying is missing now. The ascending shape of the wedge pattern, however, also has the makings of a dangerous meltdown. The market has a knack for quietly dragging unsuspecting victims to an even higher high, only to make the fall that much more dramatic.
The index would have to break under the lower edge of the wedge shape to really put such a meltdown in motion. But, between the time of year and the 9% gain we've logged since early April, we can't dismiss the likelihood of that possibility… especially given the lack of support this rally is suffering.