
It’s progress. It’s agonizingly slow, labored progress, but considering the market’s pushing its way into record-high territory after a 26% gain in less than seven months, it’s impressive.
It’s far from ideal though. In fact, it’s uncomfortably flawed.
Rally Lacking Volume
It’s a premise we continually come back to, but only because it’s an important premise. That is, if a rally is to last, at the very least it would have stable, average volume. Better yet, it would be unfurling on rising volume, suggesting traders are more and more excited to be buyers on the way up, fanning the very rally that’s stoking their excitement.
We don’t have either right now.
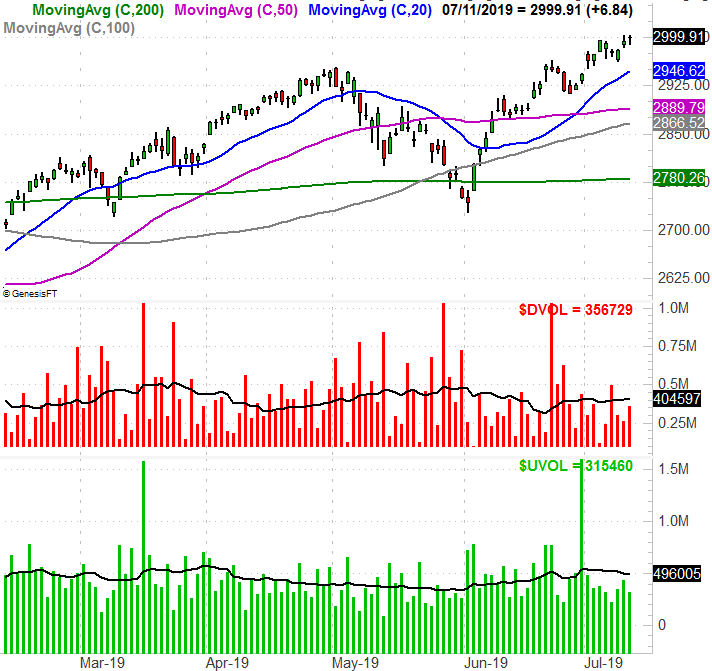
The graphic below is a fairly familiar one to regular BigTrendsers, plotting the NYSE’s daily ‘up’ volume and its average and its daily ‘down’ volume along with its average. The top portion of the chart is the S&P 500. As you can see, broadly speaking, rallies and rising bullish volume coincide, while pullbacks coincide with rising bearish volume. It’s far from perfect, but the correlation is more than strong enough to respect.
Take a closer look, however, and you’ll see something curious… the bullish volume often starts to fade before a rally reaches a peak, and the bearish volume starts to rise before a selloff takes hold.
 [1]
[1]
To that end, take a closer look at Thursday’s action. The market was up, but bearish volume outweighed bullish volume. In fact, we’ve seen this – albeit erratically – as the backdrop for a few days now.
The $64,000 question is, of course, how? The simplest short answer is, some of the market’s very biggest stocks are exerting a misleading influence on top-heavy indices. Most investors have been quietly shedding most of their positions.
Rally Lacking Breadth
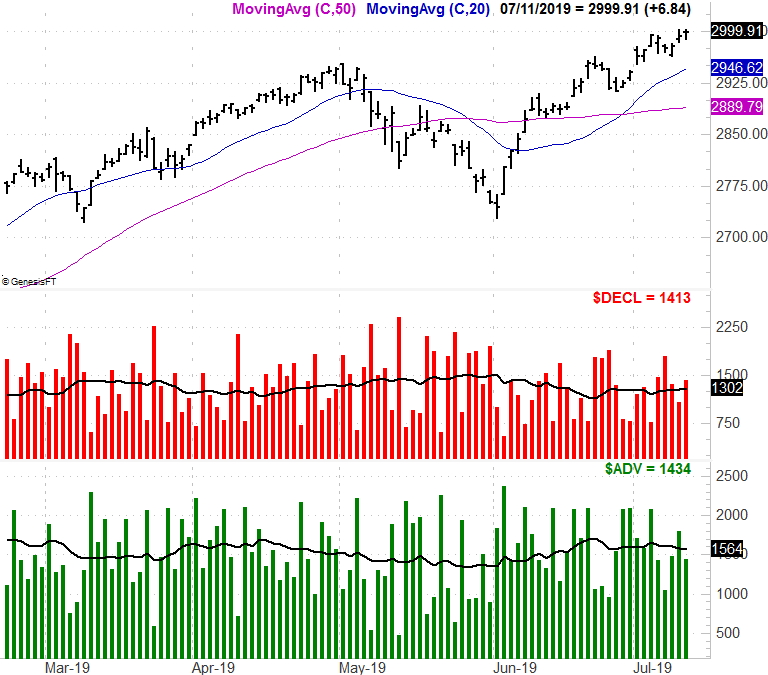
It’s not just the bearish and bullish volume that’s not-quite-right, however. This rally also lacks participation for an advance of this kind, meaning not enough stocks are actually moving higher, while a few too many stocks are moving lower. That’s what the next graphic below illustrates… the NYSE’s daily advancers and decliners, and the trend lines associated with each. Take a close look at each one’s direction.
 [2]
[2]
The so-called ‘breadth’ has been tilted bearishly for a few days now, even if stocks have managed to continue working their way higher.
Not only the up and down volume day, the breadth data turns bearish just a few days in advance of the market’s rollover, when we get them.
Stock Market Outlook
It’s not a guaranteed sign of unexpected trouble; stocks have fought their way out of worse before.
From an odds-making perspective though, this certainly doesn’t bode well. The market’s already contending with a severe overbought (and overvalued) condition, up more than 26% from their late December lows. While the prospect of a rate cut looks and feels bullish on the surface, the bulk of the recent gain has largely priced that prospect in already. Also bear in mind that a rate cut is ultimately a sign of weakness rather than strength.
It’s also concerning that a rate cut appears to be in store at a point when inflation appears to be stiff again. On Thursday, consumer inflation made the single-biggest monthly jump it’s made in a year and a half, and now stands at an annualized figure of 2.1%. That’s right around the Fed’s target, but falling rates will only facilitate more and faster inflation.
None of it means anything until the market indices start to break under their key moving average lines. For the S&P 500, they begin around 2950 with the 20-day line, though it’s the 50-day and 100-day moving average lines near 2890 that mean much more. The 200-day moving average is at 2780, but getting to that point would require a pullback of more than 7.0%… a discussion to have if-and-when.
Just know that if the market does start to deteriorate here and bearish volume and decliners continue to grow while bullish volume and advancers continue to slump, it’s not something that can be merely chalked up to a little volatility.
The VIX is also back to uncomfortably low levels, and the equity put/call ratio is starting to come up and off key lows. That’s also a discussion for another time though.