
– Alphabet stock has had a mixed year when compared to its peers. In Q4 though, it has been a leader. Can that momentum fuel it to $2,000? –
By Bret Kenwell, TheStreet.com [1]
Alphabet (GOOGL) (GOOG) stock is slightly higher on Thursday, up 0.6% on the last trading day of 2020.
While the world is collectively ready to see the calendar flip to 2021, there's a number of investors that will never forget some of the massive returns we've seen this year.
The question becomes, can stocks continue to forge higher next year?
When it comes to the analysts at Baird and Alphabet, the former seems to think that is the case for the latter.
On Thursday morning, they assigned Alphabet a $2,000 price target, implying almost 14% upside from the prior close. Can it get there?
While mega-cap tech stocks like Apple (AAPL) and Amazon (AMZN) are starting to wake up, investors are wondering if the group can finally power higher.
Trading Alphabet Stock
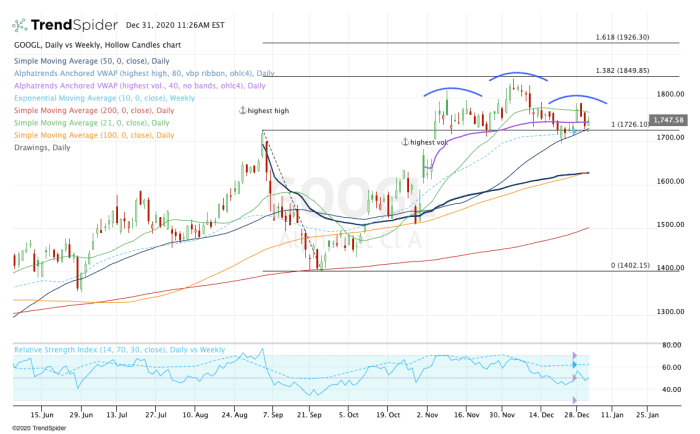
Daily chart of Alphabet stock.
 [2]
[2]
Chart courtesy of TrendSpider.com
Alphabet stock has been in the middle of the road when it comes to the FAANG stocks. Its fourth-quarter gain of 19% leads its peers, but its one-month and year-to-date gains are the worst of the FAANG components.
As we look to the daily chart, a prominent pattern sticks out: a head-and-shoulders setup.
The head-and-shoulders formation is a bearish setup that's easily visible by a notable high being straddled by two lower highs. The curved blue lines on the chart show as much. Bears are looking for Alphabet stock to break below the "neck line," which in this case comes into play around $1,700 to $1,725.
This neckline is also important because it marks the former high from this summer. In effect, Alphabet broke out over this mark and has done a good job holding up over it.
Losing the $1,725 level would also mean that Alphabet would close below the 50-day and 10-week moving averages. That was notable support last week, as Alphabet pulled back after topping out near the 138.2% extension.
If that development were to take place, it could quickly put the December low at $1,694 in play, followed by the October high and post-earnings gap-fill level near $1,680.
A dip below that could put the 100-day moving average and volume-weighted average price (WVAP) measure in play, which are currently near $1,630.
As of right now, that would likely be a solid buying opportunity provided that the overall market trends remain intact.
What if support holds rather than fails?
We need to see some rotation in that case, starting with a move over the 21-day moving average near $1,765 and this week's high near $1,788.
Above these measures will put that tricky $1,825 area on the table, followed by the 138.2% extension near $1,850, then a larger push to the 161.8% extension at $1,926.
Above all of those marks will put Baird's $2,000 price target on the table.
From TheStreet.com [1]