
— Stitch Fix is rallying on earnings but there are some concerns on the chart that need to be resolved. Here's what to watch now. —
By Bret Kenwell, TheStreet.com [1]
Stitch Fix (SFIX) is enjoying its day in the sun, up 12% on Tuesday after reporting earnings.
While shares are off the session high, Stitch Fix stock is set for its best day in several months, provided it can maintain most of its gains.
The company reported better-than-expected earnings and revenue and provided second-quarter guidance that came in above analysts' expectations. The report resulted in a slew of price target hikes for the company as well.
The tone in Stitch Fix is much different than it was a few months ago when it reported disappointing quarterly results.
At the time, I said the stock's open below $52.50 and inability to reclaim this level in the same session did not bode well for Stitch Fix investors.
While the stock did reclaim this level a few days later, it failed to hold above it and was eventually rejected by its 10-day moving average. Shares later bottomed at $37.59.
But sentiment has changed quite a bit in this one, with shares up more than 70% from the lows. Let's look at the chart.
Trading Stitch Fix
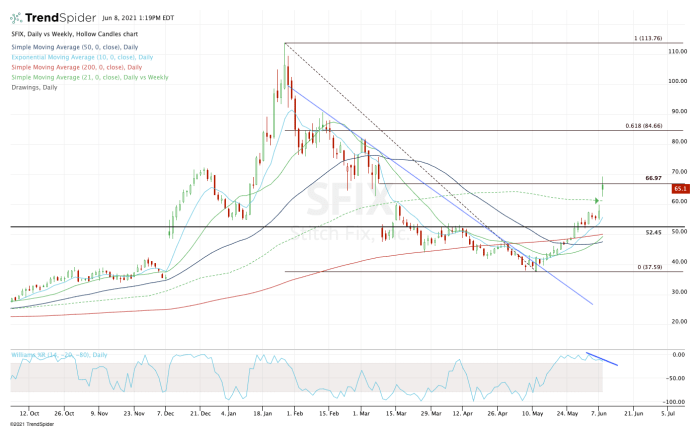
Daily chart of Stitch Fix stock
 [2]
[2]
Chart courtesy of TrendSpider.com
In late May, Stitch Fix stock powered through the $52.50 mark. This level is relevant because it's the prior all-time high.
Once it reclaimed this level, it continued to hold it as support while the 10-day moving average guided it higher.
The stock was trading well ahead of earnings, hitting its highest level since March before the report.
The stock then gapped up over $60 and the 21-week moving average. However, shares are popping right into the prior earnings gap near $67.
I have a few concerns with this setup now, the first being this week's rally into the $67 gap. There's also some divergence on the Williams %R reading at the bottom of the chart.
Does that mean we pull back hard? Not necessarily. But a drift down to the 21-week moving average and $60 level wouldn't be bad, along with a test of the 10-day moving average.
If we get that, then this setup still looks pretty healthy.
As for the upside, I want to see a move above today's high and the $70 level. That could eventually open up the 61.8% retracement of the current range, up near $85.
From TheStreet.com [1]