Most of the time a one-day setback of 2.0% for the market means something. Sometimes, it's an omen of things to come, indicating the tide has taken a decided turn for the worst. And to be clear, there was nothing fun (for the bulls) about Wednesday's action.
As ugly as today's session was, however, it's not as if this has to be the beginning of an admittedly-overdue correction.
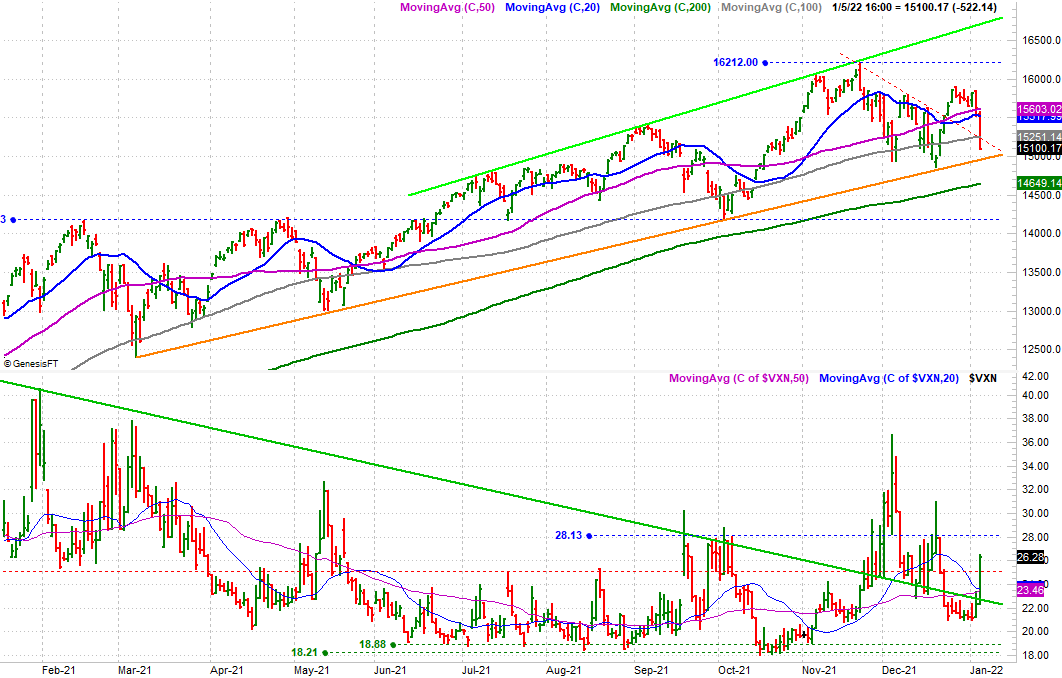
Take a look at a daily chart of the NASDAQ Composite. Wednesday's steep selloff dragged the index below its 20, 50, and 100-day moving average lines (blue, purple, and gray, respectively). But, the plunge didn't pull the composite under the long-standing support line (orange) that connects all the key lows going back to March. The NASDAQ's volatility index didn't poke above a major technical ceiling at 28.1 either.
 [1]
[1]
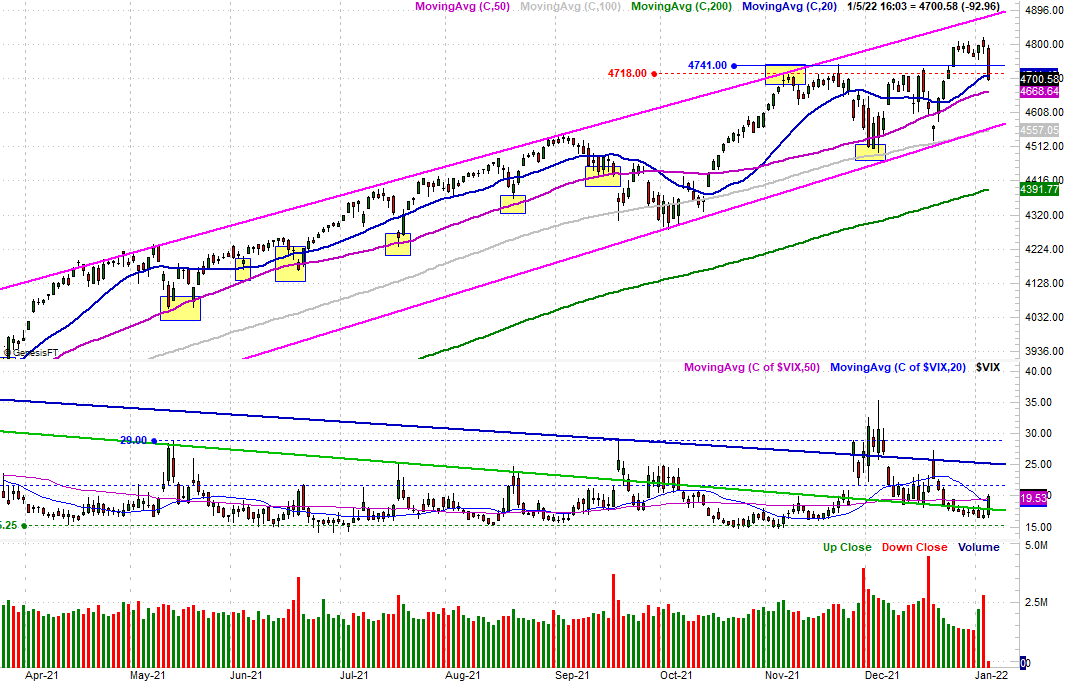
The S&P 500 held up surprisingly well too. Although its 2.0% tumble was one of the biggest single-day losses suffered in the past several months, the only real damage the selloff did was pull the index slightly below its 20-day moving average (blue) at 4711. The S&P 500 Volatility Index barely edged higher, and certainly didn't drop any hints that a major paradigm shift — upward — is in the offing.
 [2]
[2]
Nevertheless, there's cause for concern.
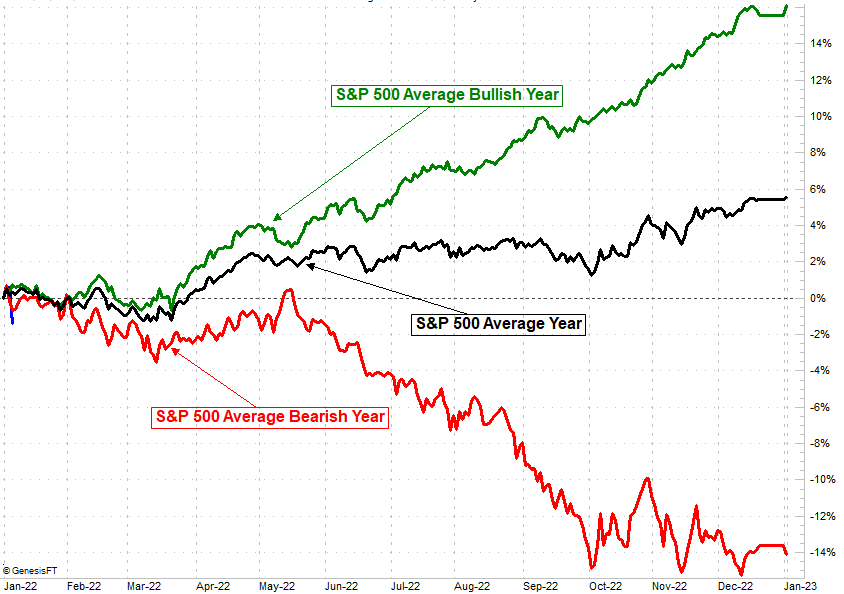
Veteran students of the market will likely know that the average January is a bullish month. Going back to 1950, the S&P 500 typically gains 0.94% for the first month of the year.
It's a tendency, however, that's skewed by older (and largely irrelevant) data. Going back to 1990, the S&P 500's average return is a more modest 0.25%. Since the year 2000, the S&P 500 has averaged a January loss of 0.36%, with half of those instances being in the red.
 [3]
[3]
What gives? Good question. Some of that weakness can partially be chalked up to the unusual circumstances and sheer bad timing of certain events. By and large though, the recent January weakness just seems routine. It would also be short-sighted to ignore the possibility that calendar-based tendencies tend to lose their impact after a while because the trading crowd starts to time the market so much that they end up producing the opposite of the expected outcome. In other words, there's so much buying being done in December in anticipation of a bullish January that there are too many sellers lined up for the market to overcome.
It's way too soon to say that's what's happening here; one rough day doesn't make a trend. As was noted, both of the key indices are still above their most important technical support levels.
Still, after Wednesday's drubbing, it's a prospect that everyone should put on their radars for the remainder of the month.
By the way, since the year 2000, the average February return for the S&P 500 is a loss of 0.57%. Most of the January losses have extended into the following month, casting more of a shadow of doubt on the market's ability to hold onto its recent gains here.