– Advanced Micro Devices and Xilinx are on the move Friday as a possible acquisition is in the works. Let's look at the charts. –
By Bret Kenwell, TheStreet.com [1]
Advanced Micro Devices (AMD) and Xilinx (XLNX) were on the move Friday as a possible acquisition was in the works.
Shares of Xilinx were up almost 17% at one point Friday on news that AMD was working toward a $30 billion takeout of the company. For its part, AMD stock had fallen about 4% on the news.
The news is coming in fast and furious, with TheStreet's own Jim Cramer suggesting that Xilinx may not be interested in a buyout.
All of this comes after Nvidia's (NVDA) recent announcement that it will acquire Arm Inc. in a $40 billion deal. Clearly both Nvidia and AMD are looking to spread their dominance and grow through M&A.
What do the charts make of the news? Let's look.
Trading AMD
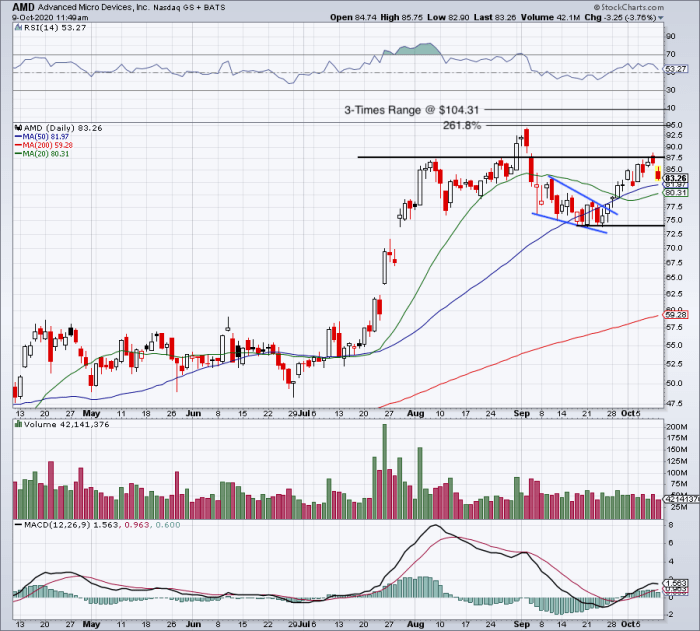
Daily chart of AMD stock.
 [2]
[2]
Chart courtesy of Stockcharts.com
On Thursday, AMD stock was rallying into resistance near $87.50. To see Friday's rejection isn't all that surprising, although how it acts from here will be interesting.
For instance, a slightly deeper dip puts it into the 20-day and 50-day moving averages. If bulls are really in control, they will buy the dip into this zone and put a retest of $87.50 back in play.
If shares can push through $88, it puts a retest of the high at $94.28 in play, along with the 261.8% extension at $95.71. Above that and $100 is in play, followed by the three-times range extension at $104.31.
Should the 20-day and 50-day moving averages fail as support, the $75 area could be in play. This zone was support during last month's pullback. A close below last month's low at $73.85 would not be a positive development for AMD stock.
Trading Xilinx
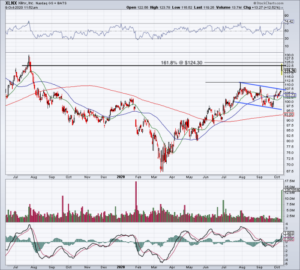
Daily chart of Xilinx stock.
 [3]
[3]
Chart courtesy of Stockcharts.com
Shares opened north of $120 and rallied slightly before pulling back. Doubts of the deal obviously do not help matters. Neither does the fact that the $120 to $125 area is a difficult zone of possible resistance.
This zone was resistance in the summer of 2019. It should be pointed out that, despite its big rally in the summer of 2019, Xilinx couldn't close above $120.50 on a weekly basis even once. Further, the 161.8% extension from the March low to the February high comes into play near $124.
Despite this hurdle, the stock has done an excellent job gapping out of its channel (blue lines) and over the prior 2020 high from July, at $111.76.
On a decline, I would like to see the July high hold as support. Below that and the $107.50 area needs to hold up, otherwise the 20-day and 50-day moving averages could be in play.
From TheStreet.com