By Melanie Schaffer, Benzinga [1]
Amazon.com, Ark Innovation ETF and GameStop Corporation are all trading higher in strong uptrends. An uptrend occurs when a stock consistently makes a series of higher highs and higher lows on the chart.
The higher highs indicate the bulls are in control, while the intermittent higher lows indicate consolidation periods. Traders can use moving averages to help identify an uptrend with rising lower timeframe moving averages (such as the eight-day or 21-day exponential moving averages), indicating the stock is in a steep shorter-term uptrend. Rising longer-term moving averages (such as the 200-day simple moving average) indicate a long-term uptrend.
A stock often signals when the higher high is in by printing a reversal candlestick such as a doji, bearish engulfing or hanging man candlestick. Likewise, the higher low could be signaled when a doji, morning star or hammer candlestick is printed. Moreover, the higher highs and higher lows often take place at resistance and support levels.
In an uptrend, the "trend is your friend" until it's not, and in an uptrend there are ways for both bullish and bearish traders to participate in the stock:
- Bullish traders who are already holding a position in a stock can feel confident the uptrend will continue unless the stock makes a lower low. Traders looking to take a position in a stock trading in an uptrend can usually find the safest entry on the higher low.
- Bearish traders can enter the trade on the higher high and exit on the pullback. These traders can also enter when the uptrend breaks and the stock makes a lower low, indicating a reversal into a downtrend may be in the cards.
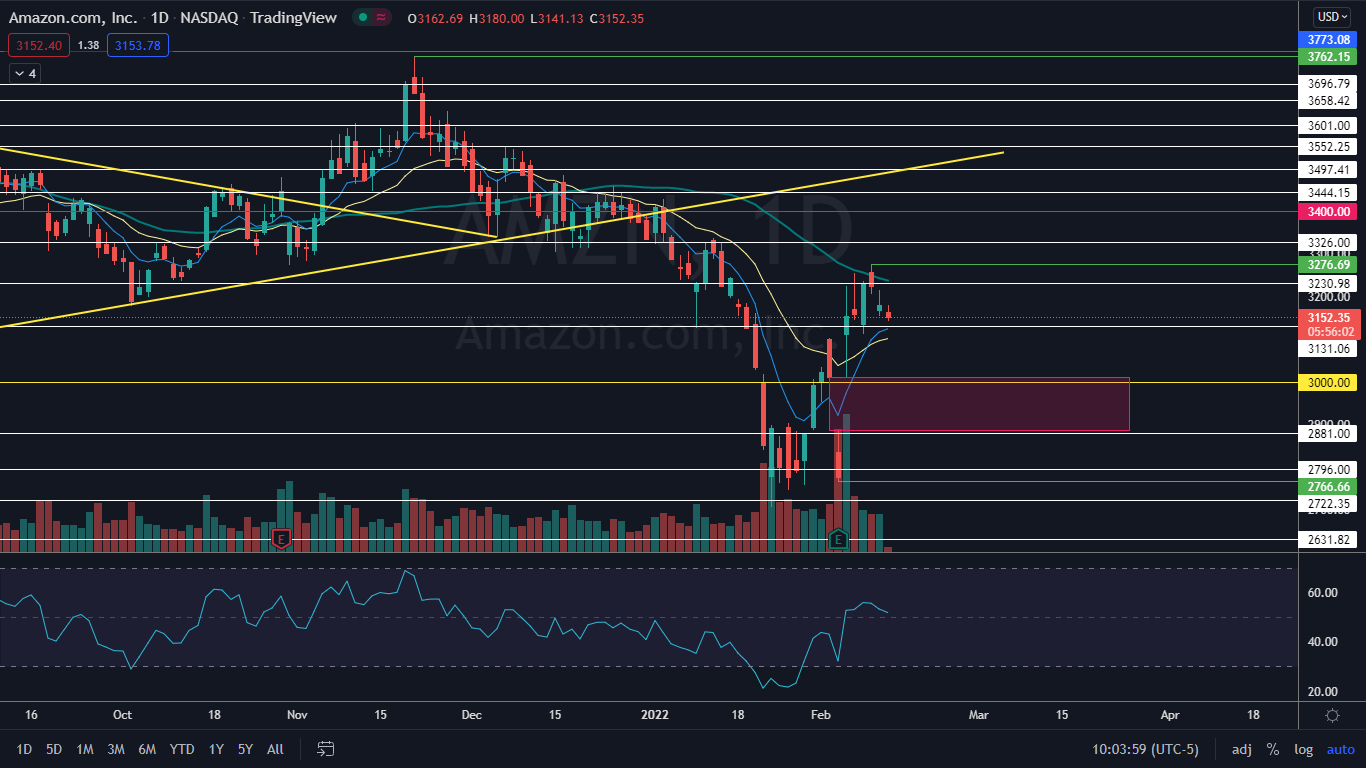
The Amazon Chart: Amazon has been trading in an uptrend since Jan. 24, with the most recent higher high created on Feb. 9 at the $3,276.69 level and the most recent confirmed higher low printed on Feb. 3 at $2,766.66.
- Amazon opened Friday's trading session mostly flat, but the slight down tick may have formed the next higher low. Traders can watch for Amazon to close the session with a reversal candlestick such as a doji or hammer to gain confidence.
- Amazon has a gap below on its chart between $2,884.95 and $3,012.16, which is about 90% likely to fill in the future. If Amazon trades lower over the coming days to fill the gap, the stock will remain in an uptrend as long as it doesn't fall below the Feb. 3 low-of-day.
- Amazon has resistance above at $3,230.98 and $3,326 and support below at $3,131.06 and $2,881.
 [2]
[2]
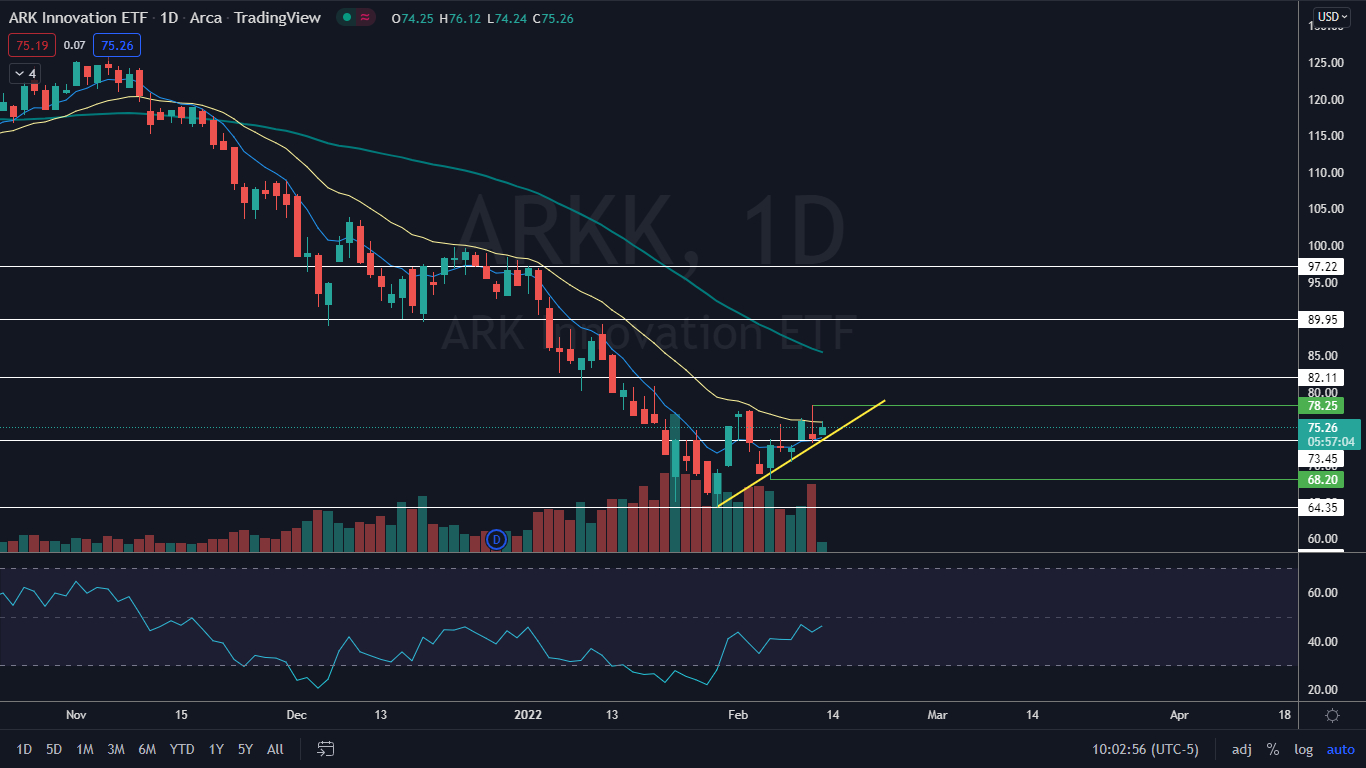
The ARKK Chart: ARKK reversed course into an uptrend on Jan. 28 and has since created a fairly consistent series of higher highs and higher low to confirm the trend change. ARKK's most recent higher low was printed on Feb. 4 at $68.20 and the most recent higher high was created on Thursday at $78.25.
- The stock may also be holding above an ascending trendline on the daily chart. If the pattern is recognized, the trendline may continue to guide ARKK higher.
- ARKK is currently being held down by the 21-day exponential moving average (EMA) and bullish traders will want to see the stock regain the level as support over the coming days.
- ARKK has resistance above at $82.11 and $89.95 and support below at $73.45 and $64.35.
 [3]
[3]
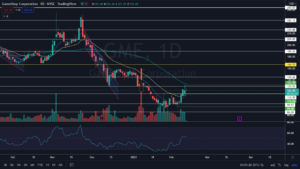
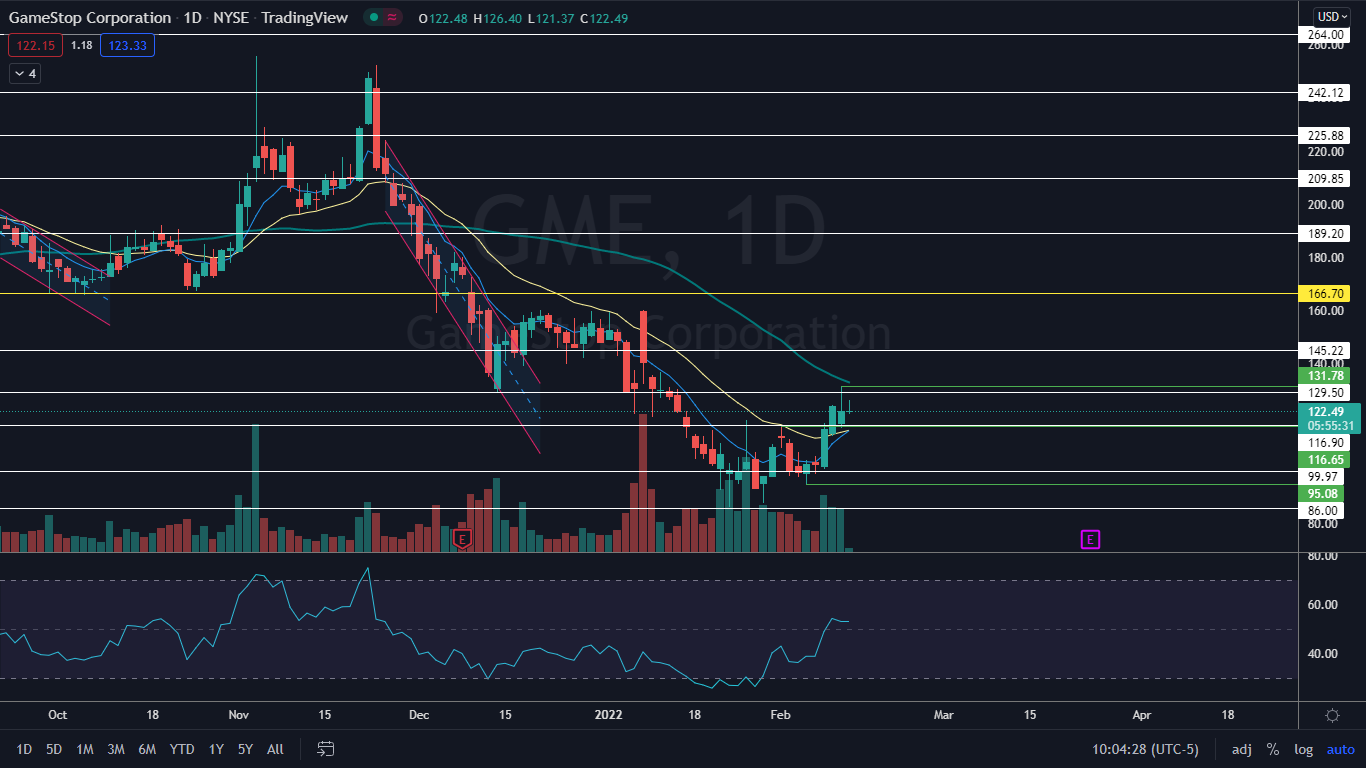
The GameStop Chart: Like Amazon, GameStop reversed course into an uptrend on Jan. 24 and has made a fairly consistent series of higher highs and higher lows, with the most recent higher high printed on Thursday at $131.78 and the most recent higher low formed on Feb. 4 at the $116.65 mark.
- Technical traders may have seen the reversal to the upside coming because GameStop printed a double bottom near the $86 level on Jan. 24 and Jan. 28.
- GameStop is trading above the eight-day and 21-day EMAs, and on Friday, the eight-day EMA was crossing above the 21-day, which is bullish. Bullish traders will want to see GameStop regain support at the 50-day simple moving average, which will indicate longer-term sentiment has become bullish.
- The stock has resistance above at $129.50 and $145.22 and support below at $116.90 and $99.97.
 [4]
[4]
From Benzinga [1]