The premise seems reasonable enough. Rarely does the market ease into or out of a trend these days. Rather, stocks tend to be jolted into or out of trouble, resulting in "V" shaped or peak-shaped bottoms or tops (respectively). The trick to knowing if a reversal effort is going to last is determining which of those reversals is started with the right underpinnings. Looking at how many of the market's, an index's, or an exchange's issues rise or fall on those potential reversal days is a good indication of just how much interest there really is in following through on a hinted move.
Problem: The 90% up and down day idea doesn't have a particularly great track record, even though it's still a highly-touted tool. The data and charts below prove it.
But, first things first.
If you're not familiar with the idea, a so-called 90% day occurs when 90% of a group of stocks logs a gain or loss on any given day. For instance, if 2520 of the NYSE's 2800 (give or take) listings rises during any given session, that's a 90% up day that portends more bullishness ahead, as hordes of investors are piling back into any and all tickers. If 450 of the S&P 500's 500 constituents loses ground on any given day, that 90% down day suggests a more significant selloff has begun, with most of the rats getting off the ship getting off as early as possible. The scope of the gain or loss isn't a factor.
The theory has taken centerstage this month, in the wake of the coronavirus contagion that's suddenly — and surprisingly — taken hold of the United States. The NYSE got close to some 90% down days in late February when trouble first started to surface. And, it logged several true 90% down days in the middle of March, with most of them hinting at more selling that would indeed take shape.
On Tuesday roles finally reversed, with the first 90% up day being logged for the NYSE's stocks since August of 2011 (though several in the meantime were in the very high 90's). Though the jury is still out on Tuesday's signal, clearly more than a few pros and amateurs are viewing it as a sign that the worst is over… that a bottom has been made.
That may well be the case. A bottom may well have been made, just as those 90% down days — and the near-90% down days in February — warned of some nasty weakness. It would be wise to not put too much faith in this particularly theory though. It seems to be more of a symptom than a sign, and it has a lousy track record.
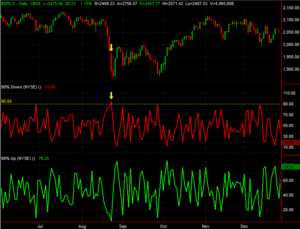
Case in point? The last time we had a true 90% down day for the NYSE's issues was back on September 9th, 2016. The chart below tells the story, comparing the S&P 500 (top) to the percentage of NYSE stocks down on any given day (red, middle) to the percentage of NYSE stocks down on any given day (green, bottom). The index did end up making lower lows, but not much lower, and not until late October into early November. And even then, acting on the signal would have left you out of a nice rally that took shape from November of that year into early 2017.
 [1]
[1]
To that end, notice what didn't happen following that questionable 90% down day. That is, we never actually saw a 90% up day afterwards, but that didn't prevent the market from recovering and moving to higher highs.
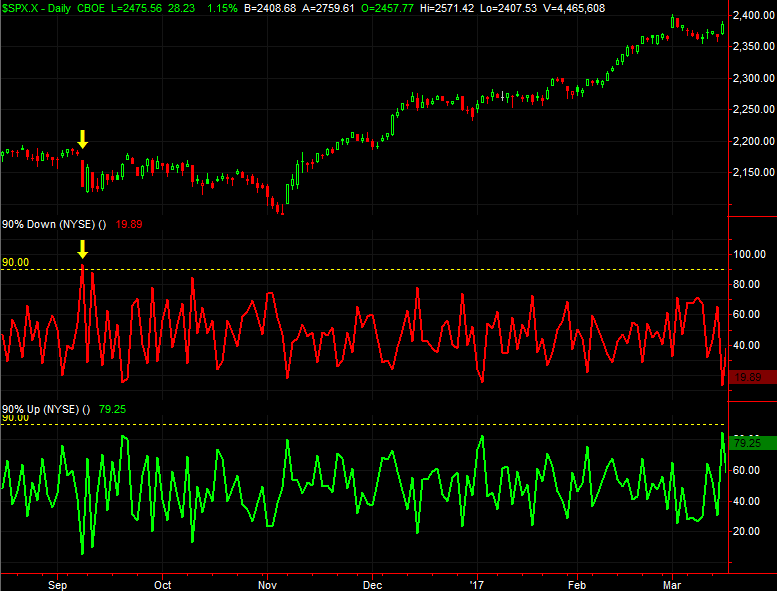
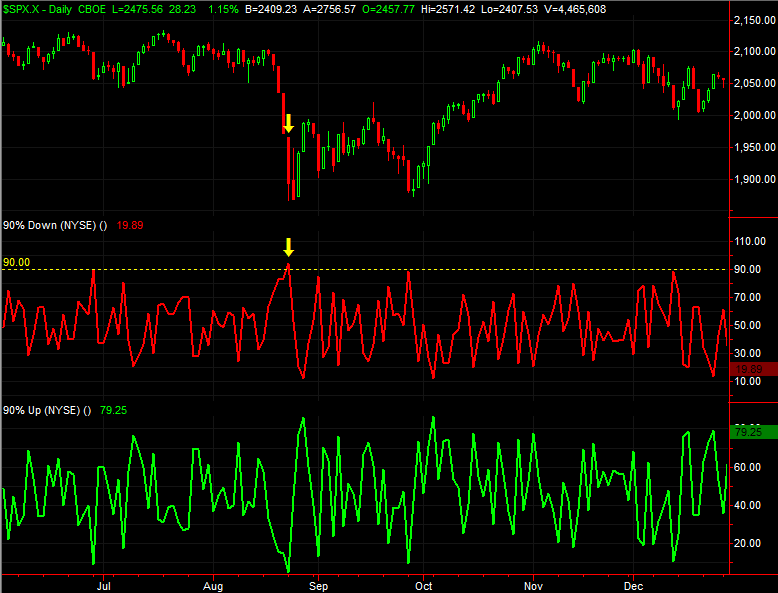
Before that, the last 90% down day for the NYSE was August 24th, 2015. Unfortunately, that red flag didn't start to wave until after the bulk of that corrective move had been dished out. The rebound started two days later, again without a 90% up day to serve as the "all clear" signal.
 [2]
[2]
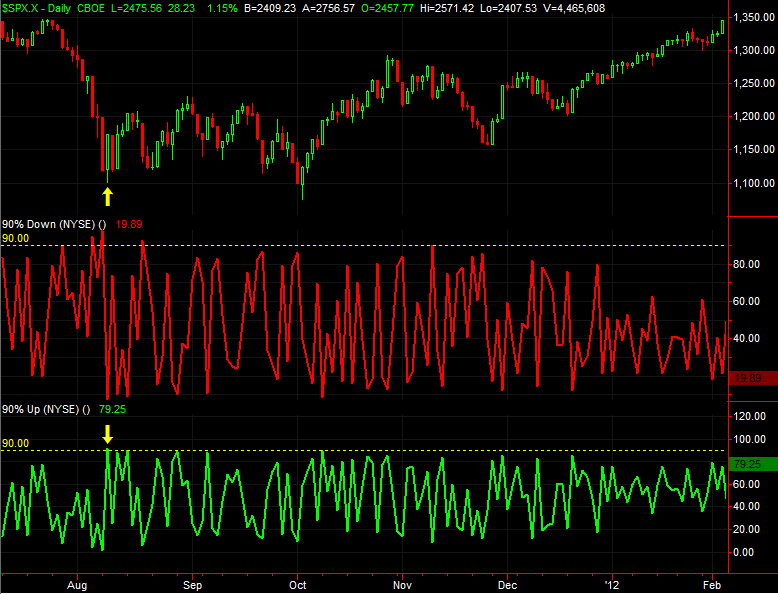
One has to go all the way back to August 9th, 2011 to fine the last actual 90% up day for NYSE issues, and to be fair, the event did flag a rebound. It was hardly a raging rebound though, with plenty of ups and downs for weeks ahead. And, perhaps most noteworthy of all was the fact that the very day before we saw a 905 down day, which should have signaled more selling ahead. As has often been the case, that particular 90% down day came after the crux of the selling had already played out.
 [3]
[3]
None of this is to suggest Tuesday's 90% up day won't lead into a true recover for the market. It is to suggest, however, that such an even alone isn't enough for a trader to make such a bet.
As is usually the case, it's data that should be heeded, but put into perspective. These technical events offer their most value as part of a collection of clues that consider all facets of the market rather than just one sliver of data. In this case, that narrow sliver is market breadth, but that's not enough by itself.