
— There's a bear market in stocks — but that doesn't mean every one of them is trading poorly. Here's some ideas among the charts. —
By Bret Kenwell, TheStreet.com [1]
There's a bear market in U.S. stocks. And in international stocks. And in cryptocurrencies. And in bonds.
Everywhere you look, there's carnage. Or should we say, almost everywhere.
Amid the damage in virtually every sector and in most asset classes, a few stocks continue to look constructive on the long side.
That doesn't mean their positive status will last forever; they, too, could get caught up in the selloff. But for now they continue to work. Let's look at them.
Exxon Mobil (XOM)
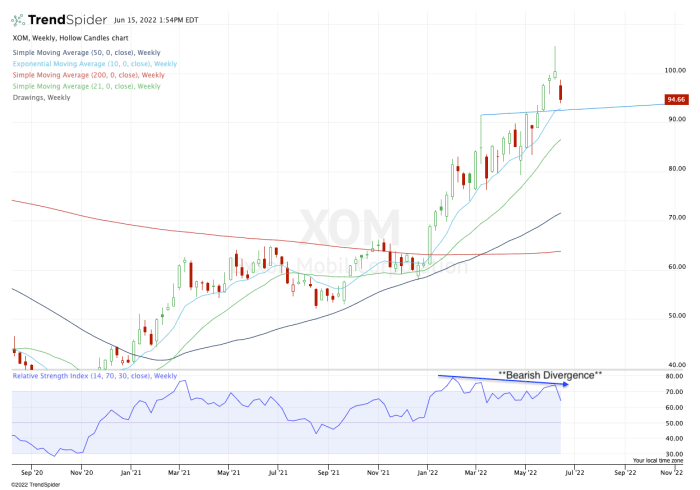
Weekly chart of Exxon Mobil stock
 [2]
[2]
Chart courtesy of TrendSpider.com
Investors shouldn't be surprised that an energy pick is one of the strongest stocks in the market right now.
While energy is the worst-performing sector on Wednesday, it's been the best-performing sector this year, up more than 30%. In fact, it's the only sector that's up year to date and over the past 12 months.
To the chart: The uptrend for Exxon Mobil (XOM) is quite clear. While that uptrend eventually will fail, it's intact for the time being.
From here, the bulls want to see the 10-week moving average and the $91.50 to $92.50 zone hold as support. If they do, a rebound back into the mid- to upper-$90s is possible, followed by a test of $100 or higher.
McKesson (MCK)
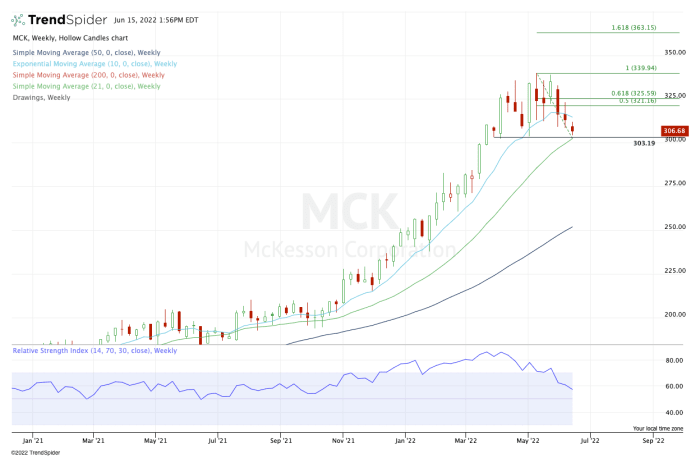
Weekly chart of McKesson stock
 [3]
[3]
Chart courtesy of TrendSpider.com
This one is pretty straightforward, as McKesson (MCK) has found resistance at $335 to $340 and support just above $300.
The giant health-care products and services provider is below active support (the 10-week moving average). But it's still one of the strongest stocks in the market as it continues to ride a broader uptrend.
From here, the bulls want to see support come into play between $300 and $305. This area has been support in the past, and also has the 21-week moving average nearby.
If it's again support, look for a bounce back to the 10-week moving average. Above that puts the $320 to $325 range in play, followed by a potential push up to $340.
Sanderson Farms (SAFM)
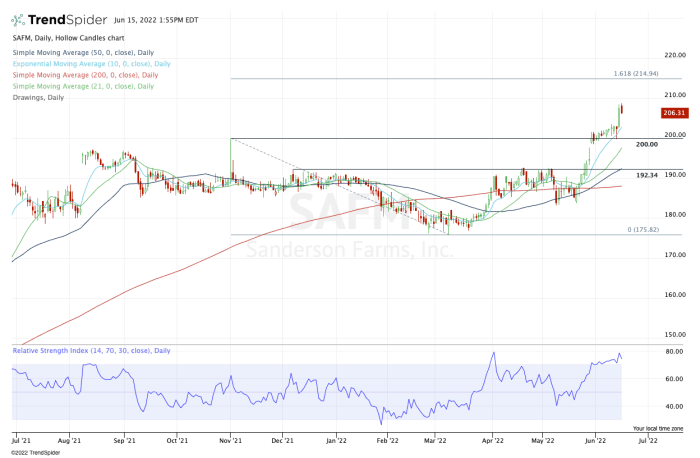
Daily chart of Sanderson Farms stock
 [4]
[4]
Chart courtesy of TrendSpider.com
Sanderson Farms (SAFM) is a bit more of a wild card, as it has a buyout deal at $203 from Continental Grain/Cargill, while the shares are currently trading near $206.
Following a strong earnings report late last month and as doubts around the deal continue to swirl, one analyst at Barclays says the stock could be valued at $250 a share without the deal.
Provided the deal doesn't come to fruition – or does so at a higher price – this one may continue to trend higher.
The bulls want to see support at the 10-day moving average. Below this measure and the $200 level will be key, where it may also find a test of the rising 21-day moving average. On the upside, keep an eye on $215.
From TheStreet.com [1]