The Fed Gives A Boost – Weekly Market Outlook
Thanks to a little help from the Federal Reserve on Wednesday, the market broke out of a three-week-old bearish rut, and in the process may have rekindled a bigger uptrend. In fact, technically speaking, the uptrend is back underway.
We’ll handicap the market below. First, let’s run down last week’s and this week’s economic news.
Economic Data
There’s little doubt as to last week’s economic focal point… the release of the minutes from the most recent FOMC meeting.
It was an interesting (and a slightly mixed) message. The Fed dropped the word “patient” from the description of how long it would wait to raise interest rates, and then made a point of saying it was in no hurry to do so given the current state of the economy.
The real curveball, though – and the key reason the U.S. Dollar may have started a pullback – was the long-term interest rate forecast the Federal Reserve’s governors offered.
Though the forecasted average Fed Funds Rate for 2015 and 2016 was only pulled back by about a quarter of a point, that’s a huge difference… and one all the dollar’s recent bulls weren’t expecting. In fact, much of the dollar’s recent rise was driven by an assumption that rates would rise even faster than had been projected. The Fed’s message suggested the opposite was in the cards, rocking the dollar, but prodding a stock market that was growing weary of such a strong greenback.
The Federal Reserve and the dollar weren’t the only items worth talking about on the economic front last week though. We also heard about February’s industrial productivity and capacity utilization data. The Industrial Production Index was up 0.1%, while capacity utilization fell from 79.1% to 78.9%. It’s not trouble yet, though a couple more months of the same could be a real red flag.
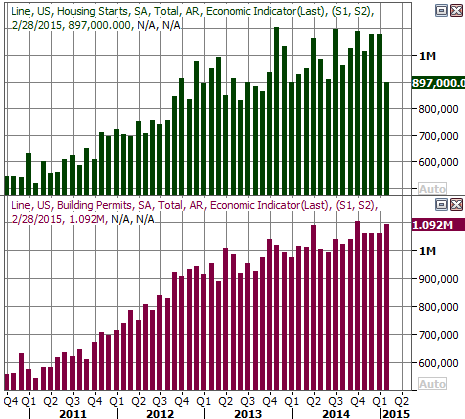
We also heard February’s housing starts and building permits data. Though starts fell from a pace of 1.081 million to 897,000, even on a seasonally-adjusted basis we can attribute the lull to a nasty wave of winter weather than ripped across much of the United States. The total number of issued permits actually grew, from 1.06 million to 1.092 million.
Housing Starts & Building Permits Chart
 [1]
[1]
Source: Thomson Reuters Eikon
Generally speaking, the housing construction trend remains a positive one.
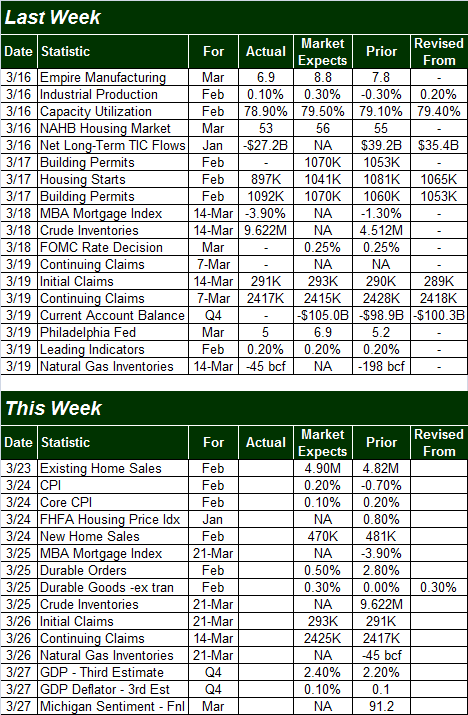
Economic Calendar
 [2]
[2]
Source: Briefing.com
This week is going to be a busy one, especially in terms of construction data. Existing as well as new-home sales are in the lineup, as well as the FHFA Housing Price Index. But, we’re also going to hear about last month’s consumer inflation rate and February’s durable goods orders. Orders are expected to be up, as is inflation (though not by much).
The CPI may be particularly important this time around, as it’s one of the two big pieces of data on the Fed’s mind right now. The Federal Reserve is targeting an annualized inflation rate of around 2.0%. If it looks like we’re getting there, that rate hike should materialize shortly afterwards.
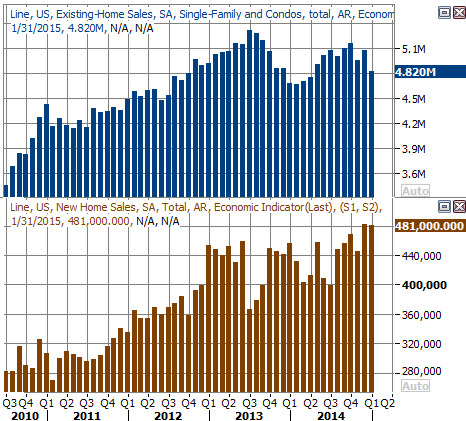
In any case, new homes sales are broadly trending higher, though existing home sales could be stronger. We’ll see what of anything, changed in February.
Home Sales, Existing and New Chart
 [3]
[3]
Source: Thomson Reuters Eikon
Stock Market Index Analysis
While the market may have danced with a fairly significant breakdown last week, the bulls did a great job of pushing the market back from the brink and back into an uptrend. As was noted above, the momentum is now bullish, and the BigTrends Trendscore is back to a fairly strong score.
That’s not to say things are risk-free, because they’re not. But, from an odds-making perspective, the picture is a bullish.
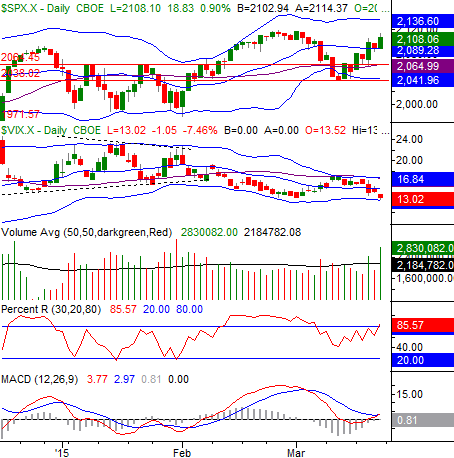
One of the biggest bullish clues is the simple fact that the S&P 500 (SPX) (SPY) is back above the 20-day moving average line, we made a bullish MACD crossover on Friday, and the Percent R line (using the BigTrends smoothed method on this indicator) is back above the 80 mark, signaling a bullish condition.
S&P 500 & VIX – Daily Chart
 [4]
[4]
Chart created with TradeStation
The risk is, primarily, the CBOE Volatilty Index (VIX) (VXX) being a little lower than average and ripe for a bounce (which is bearish for stocks). The VIX ended last week with a brush of the lower Bollinger band, which is an indirect hint that the rally could be running out of gas faster than most people realize. Valuation may become an issue too, now, as the S&P 500 is now priced at a trailing P/E of 18.4…. well beyond the norm. Even so, the picture right now is decidedly bullish, even if not ideal.
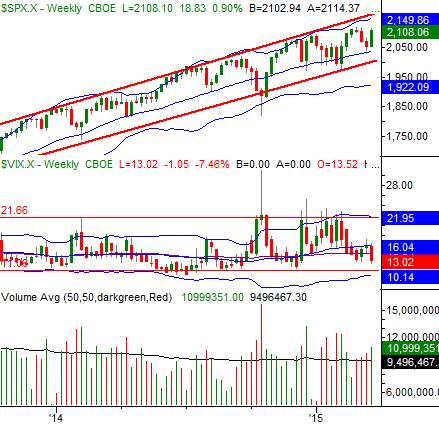
We can lean a little more bullish than we normally might based on the current risks based on the shape of things as seen on the weekly chart. It’s in this timeframe we can see the VIX has yet to test its big floor at 11.1 It’s also in this timeframe we can see the S&P 500 hasn’t yet bumped into its long-term ceiling that extends back to 2013. That’s the combination of the upper 26-week Bollinger band at 2149.9, and the long-term straight-line ceiling (red).
S&P 500 & VIX – Weekly Chart
 [5]
[5]
Chart created with TradeStation
Assuming the pattern continues to repeat itself, the S&P 500 should be able to move all the way up to the 2150 area before hitting a major headwind.
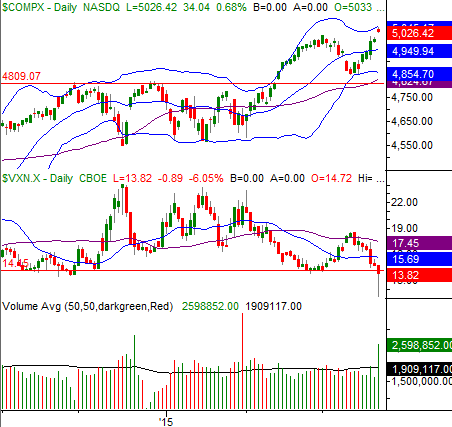
With all of that being said, the NASDAQ Composite (COMP) (QQQ) doesn’t suggest there’s as much room for near-term upside as the S&P 500 implies there is. On the daily chart of the NASDAQ here, the composite has already bumped into its upper 20-day Bollinger band as of Friday. And, the Nasdaq Volatility Index (VXN) did end up touching its major support level at the end of last week.
NASDAQ Composite & VXN – Daily Chart
 [6]
[6]
Chart created with TradeStation
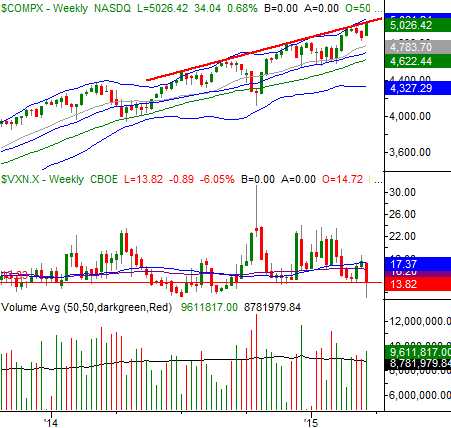
As the weekly chart of the NASDAQ Composite shows, the VXN has moved a little lower in the not-too-recent past. But, the 13.8 area is a pretty big line in the sand for the VXN. We can also see in this timeframe the NASDAQ has already bumped into a pretty big ceiling (red).
NASDAQ Composite & VXN – Weekly Chart
 [7]
[7]
Chart created with TradeStation
This is admittedly a tricky situation. It’s tough to imagine there being any more upside left to give, especially with the NASDAQ reaching its technical limits. The S&P 500 and the broad market’s overall momentum, though – along with a whole lot of bullish volume on Wednesday and Friday – suggests the edge is slightly bullish. Just be cautious (as always), and keep an eye out for red flags like the S&P 500 falling back under its 20-day moving average line at 2089.3.
Trade Well,
Price Headley
BigTrends.com
1-800-244-8736