
For new options traders, choosing the right strike and expiry is a significant worry. Even for veteran traders though, it's not always easy. Options can and do take on a life of their own, and even all the number-crunching in the world won't necessarily end up panning out as expected.
There's good news though… the more you do it, the easier it gets. Better yet, the more options trading you do, the more you innately know which strike prices and timeframes make the most sense for your strategy.
In other words, you'll reach a point where you don't have to do the math.
In the meantime though, there are a lot of if/then scenarios you'll want to walk yourself through, and a bunch of so-called 'Greeks' you'll want to compare and contrast en route to a better understanding of the art.
And when we say "compare and contrast," we mean that quite literally. Getting going in this game requires a good amount of study of not just how the Greeks vary from one selection to another, it requires a comparison of all the plausible if/then scenarios a particular stock chart may throw at you. [Keep reading, as we have a couple of links to sites that can help you do this very thing, for free.]
As is almost always the case, a real-life example of an actual trade will help serve as a learning tool.
Our guinea pig this time around will be a recent trade from our Options Shark trading advisory. It just stepped into some Mondelez (MDLZ) December (monthly – 12/21) 43 calls (MDLZ 181221C43) at a price of $2.17, or $217 per contract. The $64,000 question is, why the 43 calls that expire five weeks from now? Why not the 45 calls that expire three weeks from now, or the 41 calls that expire in January?
The only way to answer the question and learn from it is by comparing all the options available, and determining which offers the best risk-versus-reward proposition. Before doing anything along those lines though, we first need to gain a basic understanding of what's apt to be in store for MDLZ.
In that we're buying calls, clearly we're bullish, but how bullish are we?
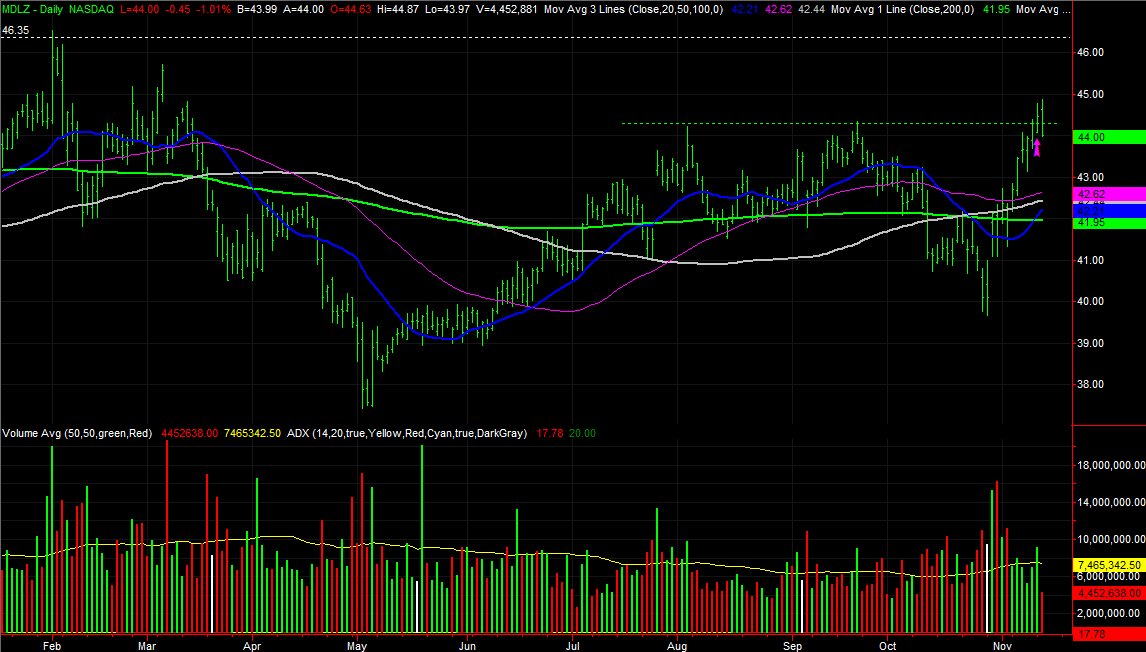
The daily chart of Mondelez below tells us quite a bit, even with just a quick glance. Namely, one of several clues pointing towards more upside is the break above the recent ceiling around $44.30 (green, dashed). But, we have good reason to believe there's a key ceiling around $46.30 (white, dashed), where MDLZ not only topped in February, but a couple of other times last year. That two-point difference is our plausible move, though we're not against giving ourselves a chance to tap into any action above and beyond $46.30.
 [1]
[1]
That's an important number to know, as it lets us start working with some hypothetical targets… which in turn helps us better compare our possible option choices. But, first things first.
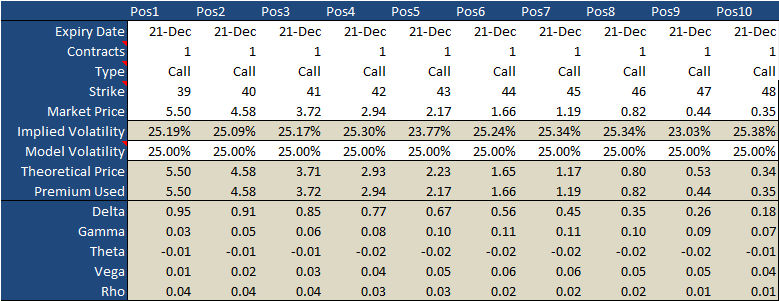
There are two ways of weighing all of our options; we'll use both. First, we can compare the Greeks of all the December-21 strikes, ranging from $39 to $48. Remember, we opted for the 43 calls with the underlying hope of Mondelez shares moving to $46, give or take. There were stocks with a higher delta, and we WANT a strong delta. But, those options also cost considerably more. And, though there were options with a lower theta, or time decay, the alternative time decay wasn't remarkably different. We're losing a couple of cents per day (or $2.00 per day for an entire contract), but that's not out of the ordinary.
 [2]
[2]
We also viewed the gamma and vega for the 43 strikes as ideal, but that's a deeper discussion we'll have to save for another time.
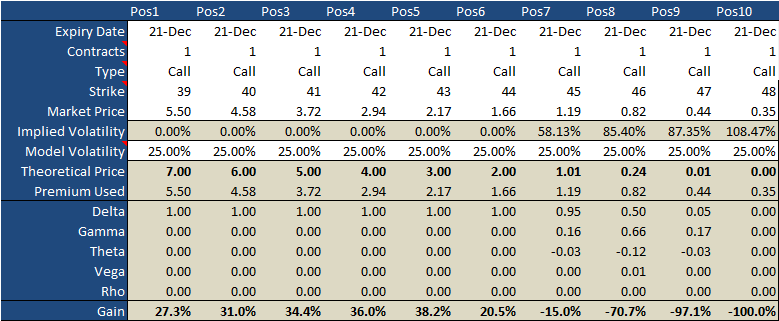
Now, here's where those options would have been, or will be, assuming MDLZ gets to that $46 target on the expiration date of December 21st.
 [3]
[3]
The tables look about the same, but with one glaring difference. The 43 calls would be worth $3.00, or $300 per contract, by that time if Mondelez were to reach $46 at or on expiration. That's a 38% win for the trade. That's actually the best net profit of all the strikes we could have considered with a December 21st expiration.
This max profit may or may not have been the case of MDLZ was above or below $46 at the expiration date. It may have also been different with a different expiration date, but, based on our most realistic outlook, the 43 strikes offer the best risk/reward scenario.
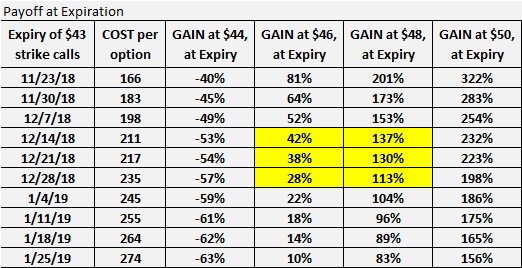
The situation can and does change if you change the expiration date. So, just to make the point, let's weigh different possible timeframes using the $43 strike for all the different expiration dates that were available to us. As you can see, the near-term expirations are more profitable in the near term (assuming MDLZ) moves as expected, but that's a less likely outcome – stocks need time to move.
 [4]
[4]
At the other end of the spectrum are the more expensive but longer-term options that still yield triple-digit returns should Mondelez move well above $46. The 'sweet spot' where risk and reward are fairly balanced is highlighted in yellow…. though you have to cross-reference the profit-and-loss table of different expirations with the table above of different strikes to really figure out what makes the most sense when choosing the optimal options.
That reality acts as the foundation for a different take-away – not only do you need to make a call about how far a stock is likely to move, you have to make a call about how long it will need to reach that target. Generally speaking, you want a stock to reach your target just before that option expires to maximize your gain and minimize your risk.
Is your head spinning? Don't sweat it. It would be surprising if it wasn't, even for experienced option traders. The point of the exercise is to illustrate how the pros and cons and risk and reward can vary widely from one option to the next. Choose carefully.
To answer the next obvious question, no, most option traders don't go through all of these steps to pick an option. Most of them can do it by feel, and experience. It's also dangerous to boil trade-selection down to a purely mathematical matter. There's always an X-factor lurking out there somewhere that can't be quantified.
Still, it wouldn't hurt to crunch the numbers for two or three different scenarios for each trade you place, particularly if you're a newcomer. A lot of newbies find they're either aiming too high or too low. If you're looking for some simple (and free) tools to help you do this, we recommend Options Profit Calculator [5] and Option-Price.com [6]. CBOE's got a good one to [7]o, though you'll have to change the 'days to expiration' to come up with some forward-looking price likelhoods. There are also some free Excel templates out there, if you're looking to do something a little more customized.
And again, it helps if you have some sort of idea about how far you think a trend can carry a stock, and how long a trend will last. You want your pick to be reaching your target right around the time the option is expiring.