Tuesday's leader isn't even in question. On the heels of news that it was raising its prices, Netflix (NFLX) shares have jumped more than 7% today. Other FANG stocks are taking that lead, but none are even a close-second. The next-biggest gain comes from Alphabet (GOOGL), though it's only up a little less than 3%.
Not all bullish thrusts are built the same, however. Indeed, not all FANG stocks are built the same.
FANG Stocks Compared
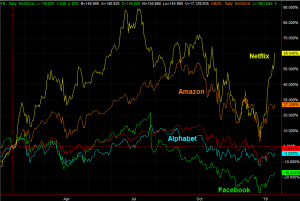
They're lumped together – Facebook (FB), Amazon (AMZN), Netflix and Alphabet – because they collectively represent the bulk of the so-called 'new economy.' That's a market that centers around the internet, and the technologies that bring out the best of the web. They each have moments better than their peers, enjoying them at different times. Over the course of the past year, Netflix has been the superstar… a role reprised of late, and on Tuesday in particular. Facebook, conversely, has been the group's poorest performer since the middle of Janaury-2018, as the impact of the Cambridge Analytica scandal has taken root in other, unexpected ways. The graphic below tells the tale. [The red line plots the performance of the Nasdaq 100 Trust (QQQ), which acts as something of a baseline for these names.]
 [1]
[1]
The sheer speed and strength of Netflix is almost intoxicating. But, as they say, the higher they fly, the farther they fall… something we saw evidence of during the latter half of last year. At the other end of the spectrum is Facebook, which was average through the first half of 2018 and subpar during the second half. The recent uptick is respectable, but far from enticing.
Take a look at each of these stocks through a different lens, however.
One at a Time
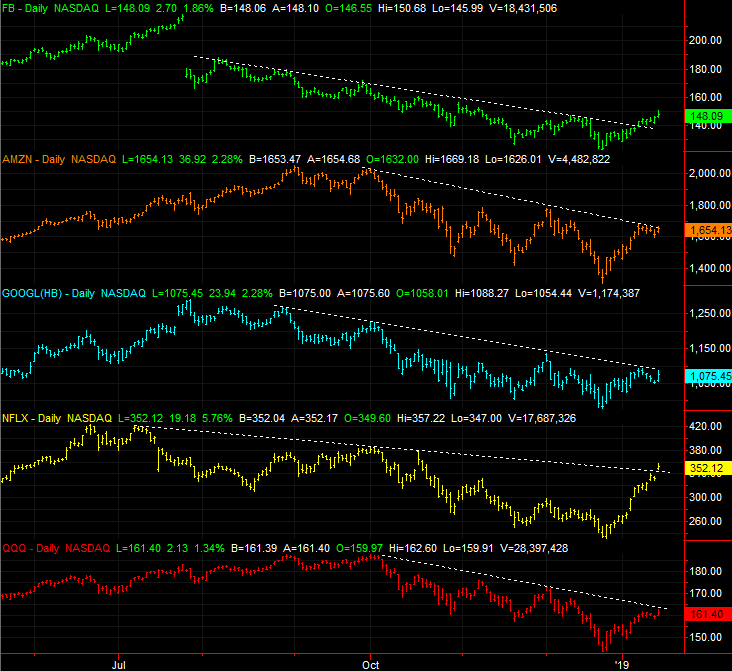
The graphic below charts each of the aforementioned five names. Of the five, only two have actually broken above long-standing resistance lines, and only one has done so in an ideal way. Netflix shares broke out today, but left behind a gap that may be closed soon enough. The other? It's Facebook, which was consistently marched its way above the falling technical ceiling responsible for most of last year's decline.
 [2]
[2]
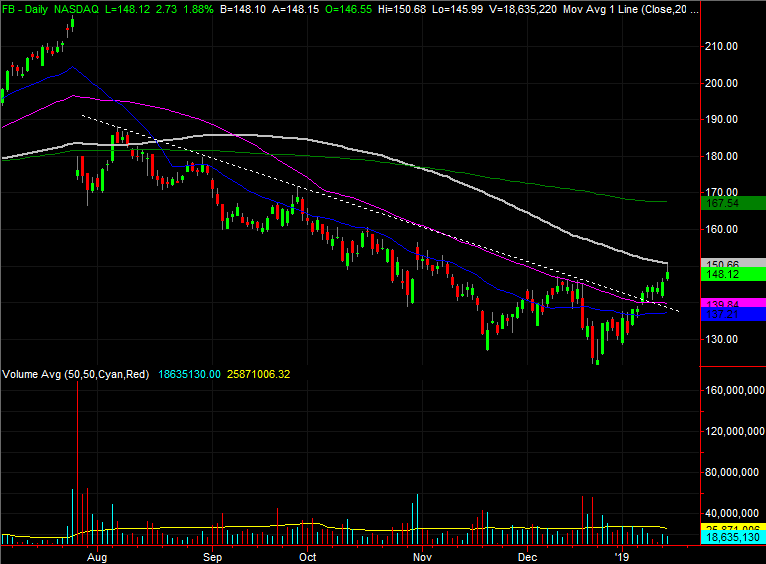
It's still not an ideal breakout thrust. Though the falling ceiling has been breached, on Tuesday, all it took was a kiss of the 100-day moving average line to get the buyers to second-guess the recent effort.
 [3]
[3]
That may not be a permanent concern. Facebook stock may only need to cool off a bit, regroup above the 50-day moving average line (purple) and then rekindle the rally and push past the 100-day moving average line (gray). Given the environment though, no trader can take anything for granted.
If the 100-day line is hurdled, the next checkpoint is the 200-day moving average line (green) around $167.50. At the other end of the spectrum, the 50-day average at $139.84 has to hold up as a floor.
Different Outcomes
This trio of charts packs several surprises, not the least of which is how the four FANG stock are far from intertwined, performance-wise. Just as surprising is that these four names dish out different opportunities at different times. The knee-jerk 'trade' here is the Netflix surge, but that chart's arguably the most overbought and ripe for a reversal. The best bet, from an odds-making perspective, is Facebook because it has the most room to recover.
Still, the three charts above verify one commonality – if you're looking for action, there's more than enough with just these tickers.
BigTrends offers an options trading advisory that focuses on just these four stocks. The FANG Options Trader Advisory Service recommends roughly eight traders per month, with holding periods of one to three days. That's the sweet spot for the market's most recognizable tickers that are subject to quick changes in sentiment. For more information, go here [4].