
— The S&P 500 and Nasdaq bounced hard to end the first quarter, but are they due to lose more ground? —
By Bret Kenwell, TheStreet.com [1]
It has not been easy to navigate the stock market this year. Not the S&P 500, not the Nasdaq and not individual stocks.
Many individual names are in the midst of a bear market. For growth stocks, many names have fallen by 60% or more.
For the broader indices, life hasn't been easy for the bulls, either.
Due to a two-day bounce in late January, the Nasdaq narrowly avoided its worst January in its 50-year history.
In mid-March, the Nasdaq and S&P 500 were down 22.5% and 13.6% from their respective highs, then exploded higher after the Fed's first rate hike in several years.
As the market pulls back and as volatility starts to climb again, what do the charts look like for these two?
Trading the S&P 500
Daily chart of the S&P 500
 [2]
[2]
Chart courtesy of TrendSpider.com
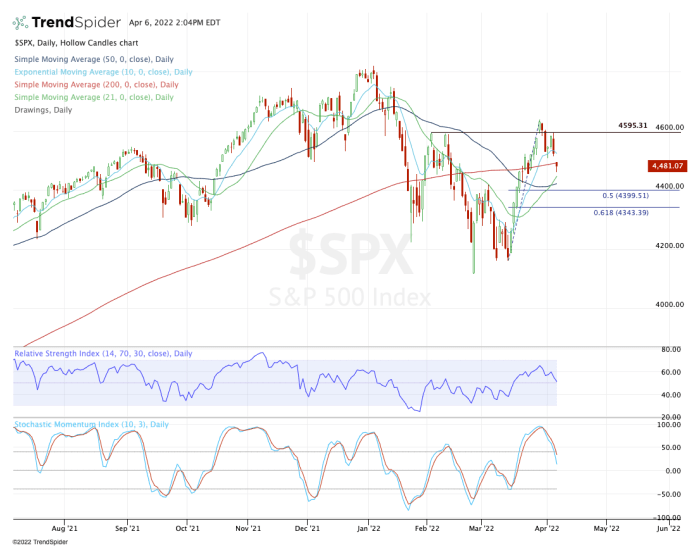
Just because the Volatility Index had been declining before this week, doesn't mean the market has been less volatile. Just look at the rally that started in the middle of March.
From the January high to the February low, the S&P 500 fell just over 700 points in a span that took 31 trading sessions and 51 days to complete.
However, it rallied roughly 520 points in just 23 sessions amid the rally. So how is that "less volatile?" Is it just because the market was heading higher?
My point is that the extreme moves can cut in both directions – and it may not be done.
On the downside, keep the 21-day and 50-day moving averages in mind. Bulls need to see these measures and the 4,440 level act as support. Below that puts the 61.8% retracement in play near 4,343.
For the SPDR S&P 500 ETF (SPY) the 61.8% retracement comes into play around $433.50. If that fails to hold, it will have investors wondering whether 4,200 is back in play. If it is, the low will be on the table, at roughly 4,114.
Trading the Nasdaq
Daily chart of the QQQ ETF
 [3]
[3]
Chart courtesy of TrendSpider.com
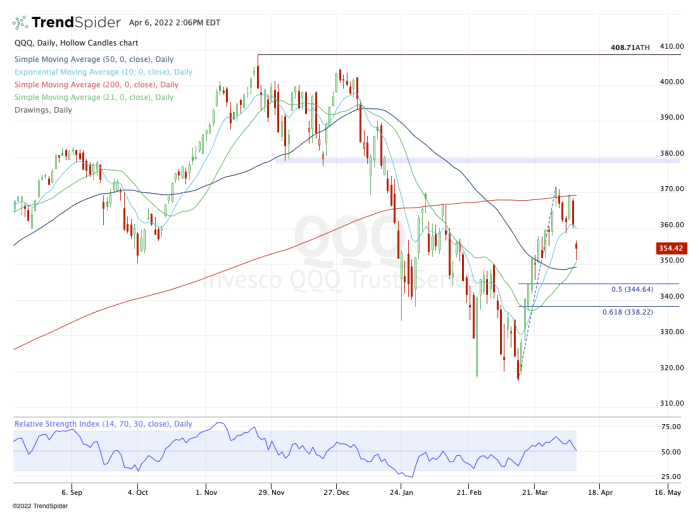
For the Nasdaq, we'll look at the Invesco QQQ Trust ETF (QQQ) – Get Invesco QQQ Trust Report. While tech has had a big move off the lows, the rally didn't make up quite as much ground as the S&P 500 when it comes to reclaiming key levels.
For all intents and purposes, the Nasdaq failed to reclaim the 200-day. While it held the short-term 10-day moving average after a back-and-forth couple of sessions, it's ultimately failing here and now rolling over.
Now we need to see $350 hold, along with the 21-day and 50-day moving averages. If they fail, $344.50 is in play.
Like the S&P – which has some wiggle room regarding its 61.8% retracement – traders will be closing watching the key 61.8% retracement on the Nasdaq, which doesn't have any wiggle room.
For the QQQ ETF, that's near $338. A close below this and investors will begin worrying about a retest or break of the lows.
So what should investors do? Simply go level to level: "If X breaks, look to Y."
From TheStreet.com [1]