
Last week we looked at a commentary from MarketWatch's Mark Hulbert, pointing out how October was the market's most volatile month. That's not necessarily a bullish or bearish thing; it could be both. It's just a message that things get more wild this month than any other month of the year, with a lot of travel between the high and the low.
Want to know that that volatility is apt to look like? Perhaps more important right now, care to know what the looming volatility is apt to look like this year? We think we know.
For the record, October is usually a winning month for stocks even though it tends to start out in the hole.
The vital stats: In 60% of all Octobers, the market makes a gain (meaning it loses ground 40% of the time). The average gain of all the winning and losing Octobers is a 0.5% gain.
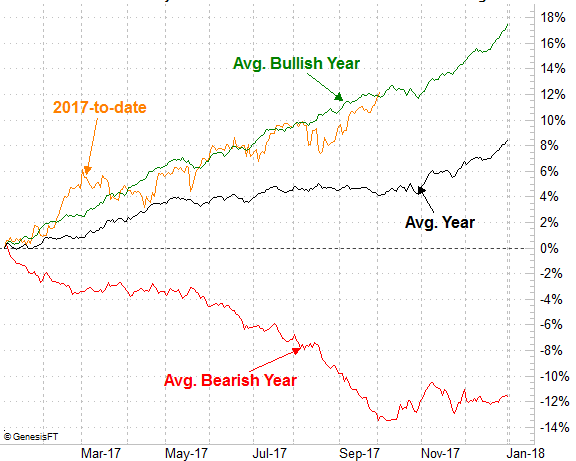
Here's the interesting part that's particularly noteworthy this time around. When the market is up for the year is it is in 2017 thus far, usually October is a winner. Conversely, when the trend is bearish and the market is down for the year come October, the month is usually a winner. Namely, when the S&P 500 is en route to a gain for the year, October is more or less a breakeven. When the index is down for the year, October gains a typical 1.5%. In most cases the bigger trend takes hold again, making October something of an outlier. But, the month has a funny history. The chart below tells the tale.
 [1]
[1]
The chart above also shows us that where the S&P 500 is as of right now is right on pace with the market's typical bullish year track. If history repeats itself, we'll see a couple more "up" days before a pullback that doesn't end until the very end of the month.
The $64,000 question: Will this October be the typical bullish year October and end up falling during the last 2/3 of the month? There's no way of knowing for sure, but it's a distinct possibility nobody can afford to ignore.
That's not the financial media's predominant message right now, by the way… at least not from most of the pundits. Some are calling for a correction of anywhere from 4% to 40%, though most are suggesting there's more upside in store. The passage of Trump's tax reform has been deemed as a potential prod for the bulls. That optimism, however, is a red flag in and of itself. The old "expect it when you least expect it" premise is a real one for the market as well.
And if the odd degrees of optimism now aren't quantifiable enough to suit you, know that the VIX's low readings right now also quantifiably confirms that confidence is oddly, dangerously low right now.
Just don't get too presumptuous. Though the momentum is strong here and all indications are that we should rocket higher, the first bad day isn't a guarantee that it's all going to come unraveled. On the flipside, be wary of a rally that's almost uncomfortably strong. That may well be a blowoff top, kick starting the correction that's long overdue.
The make or break line for the S&P 500 right now is the lower Bollinger band, currently at 2460 but rising fast. If that floor breaks rather than stops the bleeding, that's a problem. If not, we have to assume we're getting the usual year-end bullishness.
Interestingly, by the time any pullback could test the lower Bollinger band line, it would be late October, when the bulls come back to the table in bullish years after being absent for the latter 2/3 of the month.