Welcome to the new trading year! If you're a little uneasy about what to expect in the wake of last year's heroic runup, you're not alone. While investors were willing to buy into stocks on hopes that earnings would improve significantly this year, such a result isn't a foregone conclusion. Through in the ongoing uncertainty of a mid-term election year, and the future gets even fuzzier.
Thing is, while there are never any ironclad guarantees when it comes to the stock market, there are some tendencies we'd all be wise to take note of now that the new year (and the second year of a Presidential term) has begun.
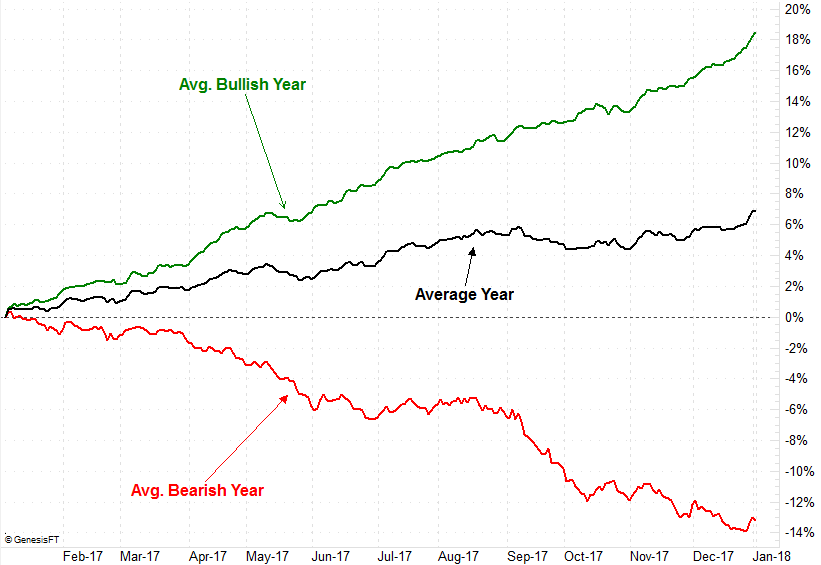
First and foremost, let's dissect the so-called January Indicator.
There's more than one of them, mind you, but the one we're most interested in is the presumption that however January turns out is an omen for the full-year. That is to say, a gain in January usually means we'll see a full-year gain, while a loss in January generally means we'll take a loss for the whole year. There's plenty of historical support for the idea, as the graphic below illustrates.
 [1]
[1]
Bearish years are much less frequent than bullish years, but more often than not, how the year starts is how the year ends. It couldn't hurt to see how the month has fared once it ends.
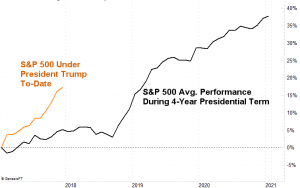
There's another tendency we all need to think about, however, in 2018. That is, how the market is apt to perform in the second full-year of a Presidential term.
The usually-controversial Donald Trump could skew the norm, or perhaps the norm will supersede any political pressure he may be able to exert on stocks. Whatever the case, it pays to know what usually happens in the second year of a President's four-year term. As the image below makes clear, the second year of a Presidency starts out strong, weakens quite a bit in the middle of the year, but rebounds incredibly well in the fourth quarter… even before the mid-term elections are completed.
 [2]
[2]
The market under President Trump thus far hasn't behaved as it usually would. His "first year" was unusually strong, with the S&P 500 gaining 17% versus a normal gain of only 5%. This sets the stage for an even bigger lull in 2018 than we might normally see, unless he somehow lights an incredible fire under the economy and catapults earnings upward. And, he may well do it. Just to be safe though, it might not hurt to prepare for all contingencies. Even if the economy does take flight, there's a lot of profit-taking potential built up here.
And just for the record, yes, it's plenty possible for January to be strong, followed by a mid-year loss, and then followed by a recovery that translates into a full-year grain. In other words, the January Indicator can still work, even if things get ugly at the mid-point of 2018.
Again, there's nothing absolutely certain about 2018, or any other year for that matter. There are always exceptions to the norm. Then again, the norm is the norm for a reason, and the tendency is for reversion to the mean rather than a deviations from it. This data, when coupled with other tools and indicators, is still helpful, even if just to help you handicap the odds.